Sears 2013 Annual Report Download - page 114
Download and view the complete annual report
Please find page 114 of the 2013 Sears annual report below. You can navigate through the pages in the report by either clicking on the pages listed below, or by using the keyword search tool below to find specific information within the annual report.-
 1
1 -
2
-
3
-
4
-
5
-
6
-
7
-
8
-
9
-
10
-
11
-
12
-
13
-
14
-
15
-
16
-
17
-
18
-
19
-
20
-
21
-
22
-
23
-
24
-
25
-
26
-
27
-
28
-
29
-
30
-
31
-
32
-
33
-
34
-
35
-
36
-
37
-
38
-
39
-
40
-
41
-
42
-
43
-
44
-
45
-
46
-
47
-
48
-
49
-
50
-
51
-
52
-
53
-
54
-
55
-
56
-
57
-
58
-
59
-
60
-
61
-
62
-
63
-
64
-
65
-
66
-
67
-
68
-
69
-
70
-
71
-
72
-
73
-
74
-
75
-
76
-
77
-
78
-
79
-
80
-
81
-
82
-
83
-
84
-
85
-
86
-
87
-
88
-
89
-
90
-
91
-
92
-
93
-
94
-
95
-
96
-
97
-
98
-
99
-
100
-
101
-
102
-
103
-
 104
104 -
 105
105 -
 106
106 -
 107
107 -
 108
108 -
 109
109 -
 110
110 -
 111
111 -
 112
112 -
 113
113 -
 114
114 -
 115
115 -
 116
116 -
 117
117 -
 118
118 -
 119
119 -
 120
120 -
 121
121 -
 122
122 -
 123
123 -
 124
124 -
125
-
126
-
127
-
128
-
129
-
130
-
131
-
132
-
133
-
134
-
135
-
136
-
137
 |
 |
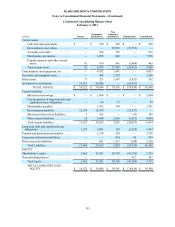
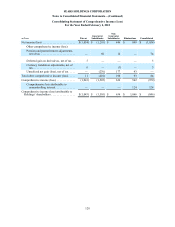
SEARS HOLDINGS CORPORATION
Notes to Consolidated Financial Statements—(Continued)
114
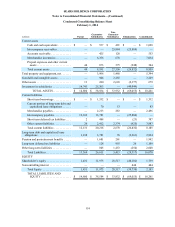
Condensed Consolidating Balance Sheet
February 1, 2014
millions Parent Guarantor
Subsidiaries
Non-
Guarantor
Subsidiaries Eliminations Consolidated
Current assets
Cash and cash equivalents . . . . . . . . . $ — $ 537 $ 491 $ — $ 1,028
Intercompany receivables. . . . . . . . . . — — 25,884 (25,884) —
Accounts receivable . . . . . . . . . . . . . . — 425 128 — 553
Merchandise inventories. . . . . . . . . . . — 6,356 678 — 7,034
Prepaid expenses and other current
assets . . . . . . . . . . . . . . . . . . . . . . . . 44 873 375 (948) 344
Total current assets . . . . . . . . . . . . . . . 44 8,191 27,556 (26,832) 8,959
Total property and equipment, net. . . . . . . — 3,906 1,488 — 5,394
Goodwill and intangible assets . . . . . . . . . — 944 2,285 — 3,229
Other assets . . . . . . . . . . . . . . . . . . . . . . . . 13 240 2,603 (2,177) 679
Investment in subsidiaries . . . . . . . . . . . . . 14,743 25,303 — (40,046) —
TOTAL ASSETS. . . . . . . . . . . . . $ 14,800 $ 38,584 $ 33,932 $ (69,055) $ 18,261
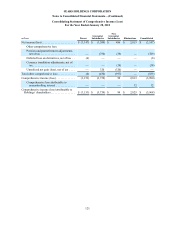
Current liabilities
Short-term borrowings . . . . . . . . . . . . $ — $ 1,332 $ — $ — $ 1,332
Current portion of long-term debt and
capitalized lease obligations . . . . . . — 70 13 — 83
Merchandise payables. . . . . . . . . . . . . — 2,213 283 — 2,496
Intercompany payables. . . . . . . . . . . . 12,103 13,781 — (25,884) —
Short-term deferred tax liabilities. . . . 2 408 — (23) 387
Other current liabilities. . . . . . . . . . . . 26 2,412 2,374 (925) 3,887
Total current liabilities . . . . . . . . . . . . 12,131 20,216 2,670 (26,832) 8,185
Long-term debt and capitalized lease
obligations . . . . . . . . . . . . . . . . . . . . . . . 1,238 3,781 76 (2,261) 2,834
Pension and postretirement benefits . . . . . — 1,681 261 — 1,942
Long-term deferred tax liabilities . . . . . . . — 128 955 26 1,109
Other long-term liabilities . . . . . . . . . . . . . — 805 1,453 (250) 2,008
Total Liabilities. . . . . . . . . . . . . . . . . . 13,369 26,611 5,415 (29,317) 16,078
EQUITY
Shareholder’s equity . . . . . . . . . . . . . . . . . 1,431 11,973 28,517 (40,182) 1,739
Noncontrolling interest . . . . . . . . . . . . . . . — — — 444 444
Total Equity . . . . . . . . . . . . . . . . . . . . 1,431 11,973 28,517 (39,738) 2,183
TOTAL LIABILITIES AND
EQUITY . . . . . . . . . . . . . . . . . . . . . $ 14,800 $ 38,584 $ 33,932 $ (69,055) $ 18,261