Sears 2013 Annual Report Download - page 119
Download and view the complete annual report
Please find page 119 of the 2013 Sears annual report below. You can navigate through the pages in the report by either clicking on the pages listed below, or by using the keyword search tool below to find specific information within the annual report.-
 1
1 -
2
-
3
-
4
-
5
-
6
-
7
-
8
-
9
-
10
-
11
-
12
-
13
-
14
-
15
-
16
-
17
-
18
-
19
-
20
-
21
-
22
-
23
-
24
-
25
-
26
-
27
-
28
-
29
-
30
-
31
-
32
-
33
-
34
-
35
-
36
-
37
-
38
-
39
-
40
-
41
-
42
-
43
-
44
-
45
-
46
-
47
-
48
-
49
-
50
-
51
-
52
-
53
-
54
-
55
-
56
-
57
-
58
-
59
-
60
-
61
-
62
-
63
-
64
-
65
-
66
-
67
-
68
-
69
-
70
-
71
-
72
-
73
-
74
-
75
-
76
-
77
-
78
-
79
-
80
-
81
-
82
-
83
-
84
-
85
-
86
-
87
-
88
-
89
-
90
-
91
-
92
-
93
-
94
-
95
-
96
-
97
-
98
-
99
-
100
-
101
-
102
-
103
-
104
-
105
-
106
-
107
-
108
-
 109
109 -
 110
110 -
 111
111 -
 112
112 -
 113
113 -
 114
114 -
 115
115 -
 116
116 -
 117
117 -
 118
118 -
 119
119 -
 120
120 -
 121
121 -
 122
122 -
 123
123 -
 124
124 -
 125
125 -
 126
126 -
 127
127 -
 128
128 -
 129
129 -
130
-
131
-
132
-
133
-
134
-
135
-
136
-
137
 |
 |

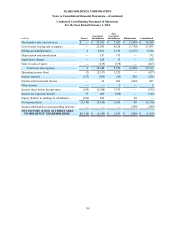
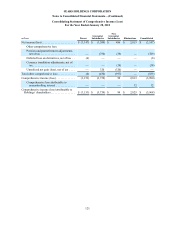
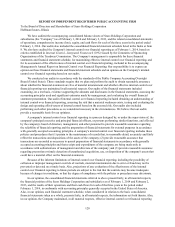
SEARS HOLDINGS CORPORATION
Notes to Consolidated Financial Statements—(Continued)
119
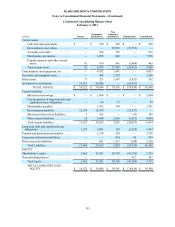
Consolidating Statement of Comprehensive Income (Loss)
For the Year Ended February 1, 2014
millions Parent Guarantor
Subsidiaries
Non-
Guarantor
Subsidiaries Eliminations Consolidated
Net income (loss). . . . . . . . . . . . . . . . . . . . . . . $ (1,116) $ (1,145) $ 1,105 $ 40 $ (1,116)
Other comprehensive income (loss):
Pension and postretirement adjustments,
net of tax . . . . . . . . . . . . . . . . . . . . . . . . — 320 102 — 422
Deferred gain on derivatives, net of tax . . 2 — — — 2
Currency translation adjustments, net of
tax . . . . . . . . . . . . . . . . . . . . . . . . . . . . . 9 — (80) — (71)
Unrealized net loss, net of tax. . . . . . . . . . —(2)(213) 215 —
Total other comprehensive income (loss) . . . . 11 318 (191) 215 353
Comprehensive income (loss) . . . . . . . . . . . . . (1,105) (827) 914 255 (763)
Comprehensive income attributable to
noncontrolling interest . . . . . . . . . . . . . ———(260)(260)
Comprehensive income (loss) attributable to
Holdings’ shareholders. . . . . . . . . . . . . . . . . $ (1,105) $ (827) $ 914 $ (5) $ (1,023)