Sears 2013 Annual Report Download - page 109
Download and view the complete annual report
Please find page 109 of the 2013 Sears annual report below. You can navigate through the pages in the report by either clicking on the pages listed below, or by using the keyword search tool below to find specific information within the annual report.-
 1
1 -
2
-
3
-
4
-
5
-
6
-
7
-
8
-
9
-
10
-
11
-
12
-
13
-
14
-
15
-
16
-
17
-
18
-
19
-
20
-
21
-
22
-
23
-
24
-
25
-
26
-
27
-
28
-
29
-
30
-
31
-
32
-
33
-
34
-
35
-
36
-
37
-
38
-
39
-
40
-
41
-
42
-
43
-
44
-
45
-
46
-
47
-
48
-
49
-
50
-
51
-
52
-
53
-
54
-
55
-
56
-
57
-
58
-
59
-
60
-
61
-
62
-
63
-
64
-
65
-
66
-
67
-
68
-
69
-
70
-
71
-
72
-
73
-
74
-
75
-
76
-
77
-
78
-
79
-
80
-
81
-
82
-
83
-
84
-
85
-
86
-
87
-
88
-
89
-
90
-
91
-
92
-
93
-
94
-
95
-
96
-
97
-
98
-
 99
99 -
 100
100 -
 101
101 -
 102
102 -
 103
103 -
 104
104 -
 105
105 -
 106
106 -
 107
107 -
 108
108 -
 109
109 -
 110
110 -
 111
111 -
 112
112 -
 113
113 -
 114
114 -
 115
115 -
 116
116 -
 117
117 -
 118
118 -
 119
119 -
120
-
121
-
122
-
123
-
124
-
125
-
126
-
127
-
128
-
129
-
130
-
131
-
132
-
133
-
134
-
135
-
136
-
137
 |
 |
SEARS HOLDINGS CORPORATION
Notes to Consolidated Financial Statements—(Continued)
109
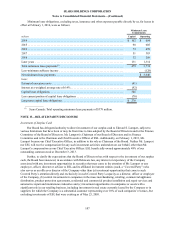
• SHO receives commissions from the Company for the sale of merchandise made through www.sears.com,
extended service agreements, delivery and handling services and credit revenues.
• The Company provides SHO with shared corporate services. These services include accounting and
finance, legal, human resources, information technology and real estate.
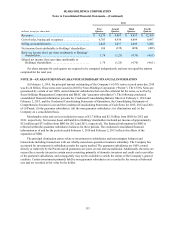
Amounts due to or from SHO are non-interest bearing, settled on a net basis, and have payment terms of 10
days after the invoice date. The Company invoices SHO on a weekly basis. At February 1, 2014 and February 2,
2013, Holdings reported a net amount receivable from SHO of $68 million and $79 million, respectively, in the
Accounts receivable line of the Consolidated Balance Sheet. Amounts related to the sale of inventory and related
services, royalties, and corporate shared services were $1.7 billion during 2013 and $513 million during the period
following the separation of SHO from October 12, 2012 through February 2, 2013. The net amounts SHO earned
related to commissions were $89 million during 2013 and $60 million during the period following the separation of
SHO from October 12, 2012 through February 2, 2013. Additionally, the Company has guaranteed lease obligations
for certain SHO store leases that were assigned as a result of the separation. See Note 4 for further information
related to these guarantees.
Also in connection with the separation, the Company entered into an agreement with SHO and the agent under
SHO's secured credit facility, whereby the Company committed to continue to provide services to SHO in
connection with a realization on the lender's collateral after default under the secured credit facility, notwithstanding
SHO's default under the underlying agreement with us, and to provide certain notices and services to the agent, for
so long as any obligations remain outstanding under the secured credit facility.
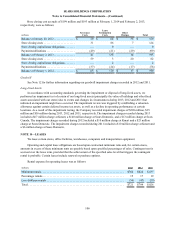
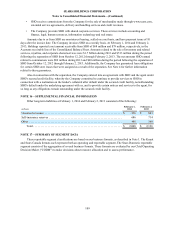
NOTE 16—SUPPLEMENTAL FINANCIAL INFORMATION
Other long-term liabilities at February 1, 2014 and February 2, 2013 consisted of the following:
millions February 1,
2014 February 2,
2013
Unearned revenues. . . . . . . . . . . . . . . . . . . . . . . . . . . . . . . . . . . . . . . . . . . . . . . . . . . . . . . $ 836 $ 843
Self-insurance reserves . . . . . . . . . . . . . . . . . . . . . . . . . . . . . . . . . . . . . . . . . . . . . . . . . . . 686 714
Other . . . . . . . . . . . . . . . . . . . . . . . . . . . . . . . . . . . . . . . . . . . . . . . . . . . . . . . . . . . . . . . . . 486 569
Total . . . . . . . . . . . . . . . . . . . . . . . . . . . . . . . . . . . . . . . . . . . . . . . . . . . . . . . . . . . . . . $ 2,008 $ 2,126
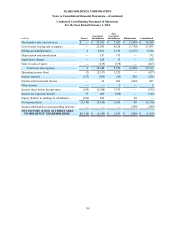
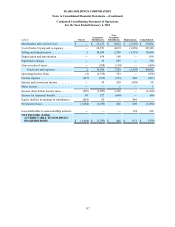
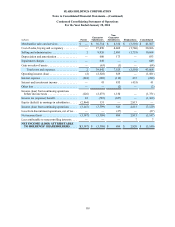
NOTE 17—SUMMARY OF SEGMENT DATA
These reportable segment classifications are based on our business formats, as described in Note 1. The Kmart
and Sears Canada formats each represent both an operating and reportable segment. The Sears Domestic reportable
segment consists of the aggregation of several business formats. These formats are evaluated by our Chief Operating
Decision Maker ("CODM") to make decisions about resource allocation and to assess performance.