Sears 2013 Annual Report Download - page 46
Download and view the complete annual report
Please find page 46 of the 2013 Sears annual report below. You can navigate through the pages in the report by either clicking on the pages listed below, or by using the keyword search tool below to find specific information within the annual report.-
 1
1 -
2
-
3
-
4
-
5
-
6
-
7
-
8
-
9
-
10
-
11
-
12
-
13
-
14
-
15
-
16
-
17
-
18
-
19
-
20
-
21
-
22
-
23
-
24
-
25
-
26
-
27
-
28
-
29
-
30
-
31
-
32
-
33
-
34
-
35
-
 36
36 -
 37
37 -
 38
38 -
 39
39 -
 40
40 -
 41
41 -
 42
42 -
 43
43 -
 44
44 -
 45
45 -
 46
46 -
 47
47 -
 48
48 -
 49
49 -
 50
50 -
 51
51 -
 52
52 -
 53
53 -
 54
54 -
 55
55 -
 56
56 -
57
-
58
-
59
-
60
-
61
-
62
-
63
-
64
-
65
-
66
-
67
-
68
-
69
-
70
-
71
-
72
-
73
-
74
-
75
-
76
-
77
-
78
-
79
-
80
-
81
-
82
-
83
-
84
-
85
-
86
-
87
-
88
-
89
-
90
-
91
-
92
-
93
-
94
-
95
-
96
-
97
-
98
-
99
-
100
-
101
-
102
-
103
-
104
-
105
-
106
-
107
-
108
-
109
-
110
-
111
-
112
-
113
-
114
-
115
-
116
-
117
-
118
-
119
-
120
-
121
-
122
-
123
-
124
-
125
-
126
-
127
-
128
-
129
-
130
-
131
-
132
-
133
-
134
-
135
-
136
-
137
 |
 |
46
Investment of Available Capital
Since the Merger, we have continued to invest in our businesses to transform the customer experience as the
retail industry evolves and provide the opportunity for attractive returns. Our Board of Directors has delegated
authority to direct investment of our surplus cash to our Chairman and Chief Executive Officer, Edward S. Lampert,
subject to various limitations that have been or may be from time to time adopted by the Board of Directors and/or
Finance Committee of the Board of Directors.
Operating Activities and Cash Flows
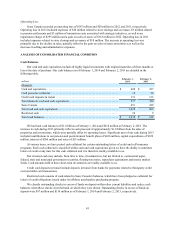
The Company used $1.1 billion of cash in its continuing operations during 2013 and $303 million during 2012.
Our primary source of operating cash flows is the sale of goods and services to customers, while the primary use of
cash in operations is the purchase of merchandise inventories. The increase in cash used in operations in 2013 was
driven primarily by increased operating losses.
The Company used $303 million in cash flows in its continuing operations during 2012 and $307 million
during 2011 as the decrease in our net loss in 2012 compared to the prior year was offset by increases in
contributions to our pension and postretirement benefit plans.
Merchandise inventories were $7.0 billion at February 1, 2014 and $7.6 billion at February 2, 2013.
Merchandise payables were $2.5 billion at February 1, 2014 and $2.8 billion at February 2, 2013. Our Domestic
inventory balances decreased approximately $355 million from $6.8 billion at February 2, 2013 to $6.4 billion at
February 1, 2014 driven by both improved productivity and store closures. Sears Domestic inventory decreased in a
majority of categories, with the most notable decreases in the apparel and jewelry categories. Kmart inventory
decreased in a majority of categories with the most notable decreases in the consumer electronics, grocery &
household, jewelry and toys categories. Sears Canada’s inventory levels decreased approximately $169 million from
$791 million at February 2, 2013 to $622 million at February 1, 2014, primarily due to the timing of merchandise
receipts and was also impacted by changes in foreign currency exchange rates.
Investing Activities and Cash Flows
We generated net cash flows from investing activities from continuing operations of $664 million in 2013 and
$191 million in 2012, compared to net cash flows used in investing activities from continuing operations of $352
million in 2011.
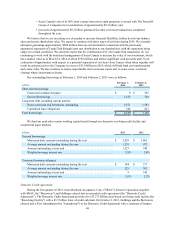
For 2013, net cash flows generated from investing activities included cash proceeds from the sales of
properties and investments of $995 million, which were partially offset by cash used for capital expenditures of
$329 million. For 2012, net cash flows generated from investing activities included cash proceeds from the sales of
properties of $532 million and $37 million from changes in investments and restricted cash, which were partially
offset by cash used for capital expenditures of $378 million. Net cash flows used in investing activities from
continuing operations in 2011 was primarily used for purchases of property and equipment.
We spent $329 million, $378 million, and $432 million during 2013, 2012 and 2011, respectively, for capital
expenditures. Capital expenditures during both 2013 and 2012 primarily included investments in online and mobile
shopping capabilities, enhancements to the Shop Your Way platform, information technology infrastructure and store
maintenance. Capital expenditures in 2011 included investments in online initiatives, information technology
infrastructure, in-home consultative sales technology, and maintenance for stores and distribution centers.
We anticipate 2014 capital expenditure levels to be similar to 2013 levels. It should be noted that in the
normal course of business, we consider opportunities to purchase leased operating properties, as well as offers to sell
owned, or assign leased, operating and non-operating properties. These transactions may, individually or in the
aggregate, result in material proceeds or outlays of cash and cause our capital expenditure levels to vary from period
to period. In addition, we review leases that will expire in the short term in order to determine the appropriate action
to take with respect to them.
Financing Activities and Cash Flows
During 2013, the Company generated net cash from financing activities from continuing operations of $902
million, primarily due to proceeds from debt issuances of $994 million, as well as an increase in short-term