Sears 2013 Annual Report Download - page 29
Download and view the complete annual report
Please find page 29 of the 2013 Sears annual report below. You can navigate through the pages in the report by either clicking on the pages listed below, or by using the keyword search tool below to find specific information within the annual report.-
 1
1 -
2
-
3
-
4
-
5
-
6
-
7
-
8
-
9
-
10
-
11
-
12
-
13
-
14
-
15
-
16
-
17
-
18
-
 19
19 -
 20
20 -
 21
21 -
 22
22 -
 23
23 -
 24
24 -
 25
25 -
 26
26 -
 27
27 -
 28
28 -
 29
29 -
 30
30 -
 31
31 -
 32
32 -
 33
33 -
 34
34 -
 35
35 -
 36
36 -
 37
37 -
 38
38 -
 39
39 -
40
-
41
-
42
-
43
-
44
-
45
-
46
-
47
-
48
-
49
-
50
-
51
-
52
-
53
-
54
-
55
-
56
-
57
-
58
-
59
-
60
-
61
-
62
-
63
-
64
-
65
-
66
-
67
-
68
-
69
-
70
-
71
-
72
-
73
-
74
-
75
-
76
-
77
-
78
-
79
-
80
-
81
-
82
-
83
-
84
-
85
-
86
-
87
-
88
-
89
-
90
-
91
-
92
-
93
-
94
-
95
-
96
-
97
-
98
-
99
-
100
-
101
-
102
-
103
-
104
-
105
-
106
-
107
-
108
-
109
-
110
-
111
-
112
-
113
-
114
-
115
-
116
-
117
-
118
-
119
-
120
-
121
-
122
-
123
-
124
-
125
-
126
-
127
-
128
-
129
-
130
-
131
-
132
-
133
-
134
-
135
-
136
-
137
 |
 |
29
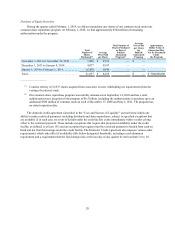
(and in particular interest rates) that are not directly related to the underlying business and that do not have
an immediate, corresponding impact on the benefits provided to eligible retirees. For further information on
the actuarial assumptions and plan assets referenced above, see Management's Discussion &Analysis -
Application of Critical Accounting Policies and Estimates - Defined Benefit Pension Plans, and Note 7 of
Notes to Consolidated Financial Statements.
• SHO separation – The results of the Sears Hometown and Outlet businesses that were included in our results
of operations prior to the separation.
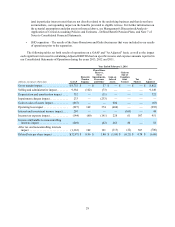
The following tables set forth results of operations on a GAAP and "As Adjusted" basis, as well as the impact
each significant item used in calculating Adjusted EBITDA had on specific income and expense amounts reported in
our Consolidated Statements of Operations during the years 2013, 2012 and 2011.
Year Ended February 1, 2014
millions, except per share data GAAP
Domestic
Pension
Expense
Closed Store
Reserve,
Store
Impairments,
Severance
and Other
Gain on
Sales of
Assets
Gain on
Sale of
Canadian
Joint
Venture Tax
Matters As
Adjusted
Gross margin impact. . . . . . . . . . . . . . . . . . $ 8,755 $ — $ 57 $ — $ — $ — $ 8,812
Selling and administrative impact. . . . . . . . 9,384 (162) (73) — — — 9,149
Depreciation and amortization impact . . . . 732 — (11) — — — 721
Impairment charges impact. . . . . . . . . . . . . 233 — (233) — — — —
Gain on sales of assets impact. . . . . . . . . . . (667) — — 604 — — (63)
Operating loss impact . . . . . . . . . . . . . . . . . (927) 162 374 (604) — — (995)
Interest and investment income impact. . . . 207 — — — (163) — 44
Income tax expense impact. . . . . . . . . . . . . (144) (60) (141) 228 61 507 451
Income attributable to noncontrolling
interests impact . . . . . . . . . . . . . . . . . . . . (249) — (42) 263 80 — 52
After tax and noncontrolling interests
impact . . . . . . . . . . . . . . . . . . . . . . . . . . . (1,365) 102 191 (113)(22) 507 (700)
Diluted loss per share impact . . . . . . . . . . . $(12.87) $ 0.96 $ 1.80 $ (1.06) $ (0.21) $ 4.78 $ (6.60)