Sara Lee 2011 Annual Report Download - page 67
Download and view the complete annual report
Please find page 67 of the 2011 Sara Lee annual report below. You can navigate through the pages in the report by either clicking on the pages listed below, or by using the keyword search tool below to find specific information within the annual report.-
 1
1 -
2
-
3
-
4
-
5
-
6
-
7
-
8
-
9
-
10
-
11
-
12
-
13
-
14
-
15
-
16
-
17
-
18
-
19
-
20
-
21
-
22
-
23
-
24
-
25
-
26
-
27
-
28
-
29
-
30
-
31
-
32
-
33
-
34
-
35
-
36
-
37
-
38
-
39
-
40
-
41
-
42
-
43
-
44
-
45
-
46
-
47
-
48
-
49
-
50
-
51
-
52
-
53
-
54
-
55
-
56
-
 57
57 -
 58
58 -
 59
59 -
 60
60 -
 61
61 -
 62
62 -
 63
63 -
 64
64 -
 65
65 -
 66
66 -
 67
67 -
 68
68 -
 69
69 -
 70
70 -
 71
71 -
 72
72 -
 73
73 -
 74
74 -
 75
75 -
 76
76 -
 77
77 -
78
-
79
-
80
-
81
-
82
-
83
-
84
-
85
-
86
-
87
-
88
-
89
-
90
-
91
-
92
-
93
-
94
-
95
-
96
-
97
-
98
-
99
-
100
-
101
-
102
-
103
-
104
-
105
-
106
-
107
-
108
-
109
-
110
-
111
-
112
-
113
-
114
-
115
-
116
-
117
-
118
-
119
-
120
-
121
-
122
-
123
-
124
 |
 |

64/65 Sara Lee Corporation and Subsidiaries
2010 versus 2009
The cash used in financing activities in 2010
increased by $34 million over the prior year due primarily to a
$397 million increase in cash used to repurchase shares of the corpo-
ration’s common stock partially offset by a $357 million reduction
in the net repayment of both long-term and short-term debt.
The corporation expended $500 million in 2010 to repurchase
36.4 million shares of its common stock under an accelerated
share repurchase program as part of a new capital structure plan.
During 2009, the corporation repurchased 11.4 million shares of
common stock for $103 million.
In 2010, the corporation had net repayments of other debt and
financings less than 90 days of $6 million, which was a $357 mil-
lion reduction from the $363 million in net repayments in 2009.
The corporation utilized a combination of cash on hand, short-term
borrowings and new borrowings of long-term debt to repay maturing
long-term debt. The long-term debt maturing during 2009 was repaid
using cash on hand and a new 2-year financing arrangement for
€285 million at Euribor plus 1.75% that was entered into in
January 2009.
Dividends paid during 2010 were $308 million as compared to
$302 million in 2009. The annualized dividend rate per share was
$0.44 per share for both years.
Liquidity
Notes Payable Notes payable increased from $47 million at July 3,
2010 to $238 million at July 2, 2011. The higher debt levels were
used to fund increased working capital and other short-term cash
needs in the U.S. and Brazil. At the end of 2011, the corporation
had cash and cash equivalents on the balance sheet of $2.066 bil-
lion, which was $1.111 billion higher than the balance at July 3,
2010 due primarily to the cash proceeds received from the dispo-
sition of the majority of the household and body care businesses.
Anticipated Business Dispositions/Use of Proceeds Sara Lee has
made substantial progress toward divesting its International house-
hold and body care businesses. The company closed transactions
for the divestiture of the majority of its air care business to Procter
& Gamble and the global body care and European detergents busi-
ness to Unilever for approximately $2 billion in the first half of 2011.
The company has closed on the sale of its Australia/New Zealand
bleach business for €37.9 million on February 7, 2011 and closed
on the sale of the majority of its global shoe care business for
$276 million on April 4, 2011.
The amount of contingent sale proceeds received in 2010, was
$17 million lower than the prior year due to the impact of foreign
currency exchange rates as the corporation received €95 million
in both years.
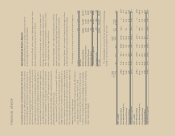
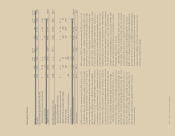
Cash used in Financing Activities The net cash used in financing
activities is split between continuing and discontinued operations
as follows:
2011 2010 2009
Cash used in financing activities
Continuing operations $÷÷916 $(176) $(299)
Discontinued operations (2,667) (625) (468)
Total $(1,751) $(801) $(767)
The cash used in the financing activities of the discontinued
operations primarily represents the net transfers of cash with the
corporate office as most of the cash of these businesses has been
retained as a corporate asset.
2011 versus 2010
The cash used in financing activities in 2011
increased by $950 million over the prior year due primarily to a
$813 million increase in cash used to repurchase shares of the
corporation’s common stock and a $199 million increase in the
net repayment of both long-term and short-term debt.
In 2011, the corporation repurchased 80.2 million shares of
common stock for $1.3 billion. In 2010, the corporation expended
$500 million to repurchase 36.4 million shares of its common
stock under an accelerated share repurchase program.
In 2011, the corporation had net repayments of other debt and
financings less than 90 days of $205 million, which was $199 mil-
lion higher than the prior year. The corporation utilized a combination
of cash on hand, short-term borrowings and new borrowings of
long-term debt to repay maturing long-term debt. During 2011, the
corporation repaid its $1.1 billion 6.25% Note due in September
2011 and issued $400 million of 2.75% Notes due in September
2015 and $400 million of 4.1% Notes due in September 2020.
The remaining portion of the debt repayment was funded through
short term borrowings and cash on hand.
Dividends paid during 2011 were $285 million as compared to
$308 million in 2010. The reduction in dividends is due in part to the
impact of the share repurchases. The annualized dividend rate per
share was $0.46 per share in 2011 and $0.44 per share in 2010.