Sara Lee 2011 Annual Report Download - page 114
Download and view the complete annual report
Please find page 114 of the 2011 Sara Lee annual report below. You can navigate through the pages in the report by either clicking on the pages listed below, or by using the keyword search tool below to find specific information within the annual report.-
 1
1 -
2
-
3
-
4
-
5
-
6
-
7
-
8
-
9
-
10
-
11
-
12
-
13
-
14
-
15
-
16
-
17
-
18
-
19
-
20
-
21
-
22
-
23
-
24
-
25
-
26
-
27
-
28
-
29
-
30
-
31
-
32
-
33
-
34
-
35
-
36
-
37
-
38
-
39
-
40
-
41
-
42
-
43
-
44
-
45
-
46
-
47
-
48
-
49
-
50
-
51
-
52
-
53
-
54
-
55
-
56
-
57
-
58
-
59
-
60
-
61
-
62
-
63
-
64
-
65
-
66
-
67
-
68
-
69
-
70
-
71
-
72
-
73
-
74
-
75
-
76
-
77
-
78
-
79
-
80
-
81
-
82
-
83
-
84
-
85
-
86
-
87
-
88
-
89
-
90
-
91
-
92
-
93
-
94
-
95
-
96
-
97
-
98
-
99
-
100
-
101
-
102
-
103
-
 104
104 -
 105
105 -
 106
106 -
 107
107 -
 108
108 -
 109
109 -
 110
110 -
 111
111 -
 112
112 -
 113
113 -
 114
114 -
 115
115 -
 116
116 -
 117
117 -
 118
118 -
 119
119 -
 120
120 -
 121
121 -
 122
122 -
 123
123 -
 124
124
 |
 |

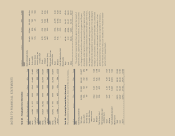
NOTES TO FINANCIAL STATEMENTS
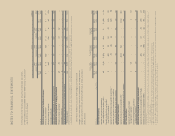
Note 18 – Income Taxes
The provisions for income taxes on continuing operations computed
by applying the U.S. statutory rate to income from continuing opera-
tions before taxes as reconciled to the actual provisions were:
2011 2010 2009
Income (loss) from continuing
operations before income taxes
United States 7.6 % 1.4 % (98.9) %
Foreign 92.4 98.6 198.9
100.0 % 100.0 % 100.0 %
Tax expense (benefit) at
U.S. statutory rate 35.0 % 35.0 % 35.0 %
Tax on remittance of foreign earnings 6.0 22.0 14.6
Finalization of tax reviews and audits and
changes in estimate on tax contingencies (4.0) (25.1) (7.1)
Foreign taxes different than
U.S. statutory rate (12.8) (8.4) (19.1)
Valuation allowances 8.9 (0.6) 2.9
Benefit of foreign tax credits – – (5.4))
Contingent sale proceeds – (6.6) (17.7)
Tax rate changes – – (0.3)
Goodwill impairment – – 28.4
Tax provision adjustments (1.7) 2.6 2.9
Other, net (0.7) (1.3) 4.2
Taxes at effective worldwide tax rates 30.7 % 17.6 % 38.4 %
The tax expense related to continuing operations increased
$25 million in 2011 despite a $219 million decline in pretax income
from continuing operations. The increase in tax expense in 2011
was due to the year-over-year impact of a net tax benefit reported
in 2010 that included a $177 million tax benefit for the release of
certain contingent tax obligations after statutes in multiple jurisdic-
tions lapsed and certain tax regulatory examinations and reviews
were resolved, and a $47 million tax benefit related to the contin-
gent sales proceeds partially offset by a tax charge of $121 million
related to the corporation’s decision to no longer reinvest overseas
earnings primarily attributable to existing overseas cash and the
book value of the household and body care businesses.
The tax expense related to continuing operations was $9 million
higher in 2010 than in 2009 primarily due to a $408 million increase
in income from continuing operations before income taxes and a
tax charge of $121 million related to the corporation’s decision
to no longer reinvest overseas earnings primarily attributable to
existing overseas cash and the book value of the household and
body care businesses. Partially offsetting this was a benefit of
$177 million for the release of certain contingent tax obligations
as discussed above.
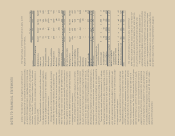
The funded status of postretirement health-care and life-insurance
plans related to continuing operations at the respective year-ends were:
In millions 2011 2010
Accumulated postretirement benefit obligation
Beginning of year $«104 $÷«89
Service cost 21
Interest cost 56
Net benefits paid (9) (12)
Plan participant contributions 21
Actuarial (gain) loss (12) 13
Plan amendments –7
Foreign exchange 1 (1)
End of year 93 104
Fair value of plan assets 1–
Funded status $÷(92) $(104)
Amounts recognized on the
consolidated balance sheets
Accrued liabilities $÷÷(7) $÷÷(9)
Other liabilities (85) (95)
Total liability recognized $÷(92) $(104)
Amounts recognized in accumulated
other comprehensive loss
Unamortized prior service credit $(137) $(157)
Unamortized net actuarial loss 26 51
Unamortized net initial asset (3) (5)
Total $(114) $(111)
A significant portion of the unamortized prior service credits
relates to the North American fresh bakery operations. As such,
at the time of the completion of the sale of this business, which
is expected to be in the first quarter of 2012, these unamortized
prior service credits will be recognized as part of the gain/loss
on disposition of this business.
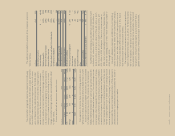
Expected Benefit Payments and Funding Substantially all
postretirement health-care and life-insurance benefit payments are
made by the corporation. Using foreign exchange rates at July 2,
2011 and expected future service, it is anticipated that the future
benefit payments that will be funded by the corporation will be as
follows: $8 million in 2012, 2013, 2014, 2015, and 2016 and
$43 million from 2017 to 2021.
The Medicare Part D subsidy received by the corporation
was $2 million in 2010. The subsidy received in 2011 and 2009
was not material.