Sara Lee 2011 Annual Report Download - page 52
Download and view the complete annual report
Please find page 52 of the 2011 Sara Lee annual report below. You can navigate through the pages in the report by either clicking on the pages listed below, or by using the keyword search tool below to find specific information within the annual report.-
 1
1 -
2
-
3
-
4
-
5
-
6
-
7
-
8
-
9
-
10
-
11
-
12
-
13
-
14
-
15
-
16
-
17
-
18
-
19
-
20
-
21
-
22
-
23
-
24
-
25
-
26
-
27
-
28
-
29
-
30
-
31
-
32
-
33
-
34
-
35
-
36
-
37
-
38
-
39
-
40
-
41
-
 42
42 -
 43
43 -
 44
44 -
 45
45 -
 46
46 -
 47
47 -
 48
48 -
 49
49 -
 50
50 -
 51
51 -
 52
52 -
 53
53 -
 54
54 -
 55
55 -
 56
56 -
 57
57 -
 58
58 -
 59
59 -
 60
60 -
 61
61 -
 62
62 -
63
-
64
-
65
-
66
-
67
-
68
-
69
-
70
-
71
-
72
-
73
-
74
-
75
-
76
-
77
-
78
-
79
-
80
-
81
-
82
-
83
-
84
-
85
-
86
-
87
-
88
-
89
-
90
-
91
-
92
-
93
-
94
-
95
-
96
-
97
-
98
-
99
-
100
-
101
-
102
-
103
-
104
-
105
-
106
-
107
-
108
-
109
-
110
-
111
-
112
-
113
-
114
-
115
-
116
-
117
-
118
-
119
-
120
-
121
-
122
-
123
-
124
 |
 |

FINANCIAL REVIEW
• Cash from operating activities was $447 million in 2011, a
decrease of $505 million due to the decline in operating results,
the impact of business dispositions and increased working capital
usage partially offset by lower cash payments for pensions.
• Under the corporation’s capital plan, the company expended
$1.3 billion to repurchase 80.2 million shares of its common stock.
Significant Items Affecting Comparability The reported results for
2011, 2010 and 2009 reflect amounts recognized for restructuring
actions and other significant amounts that impact comparability.
“Significant items” are income or charges (and related tax impact)
that management believes have had or are likely to have a significant
impact on the earnings of the applicable business segment or on
the total corporation for the period in which the item is recognized,
are not indicative of the company’s core operating results and
affect the comparability of underlying results from period to period.
Significant items may include, but are not limited to: charges for
exit activities; transformation program and Project Accelerate costs;
spin-off related costs; impairment charges; pension partial with-
drawal liability charges; benefit plan curtailment gains and losses;
tax charges on deemed repatriated earnings; tax costs and benefits
resulting from the disposition of a business; impact of tax law
changes; changes in tax valuation allowances and favorable or unfa-
vorable resolution of open tax matters based on the finalization of
tax authority examinations or the expiration of statutes of limitations.
The impact of the above items on net income and diluted earnings
per share is summarized on the following page.
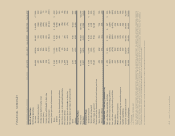
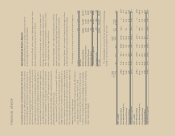
Impact of significant items on income from continuing
operations before income taxes:
In millions 2011 2010 2009
Pretax Impact
Cost of sales $÷÷(2) $÷«÷– $÷÷«6
Selling, general and admin expenses (58) (40) 11
Exit and business dispositions (105) (84) (98)
Impairment charges (21) (28) (314)
Debt extinguishment costs (55) – –
Total $(241) $(152) $(395)
Management also uses certain of these non-GAAP financial
measures, in conjunction with the GAAP financial measures, to
understand, manage and evaluate our businesses, in planning for
and forecasting financial results for future periods, and as one fac-
tor in determining achievement of incentive compensation. Two of
the three performance measures under Sara Lee’s annual incentive
plan are net sales and operating income, which are the reported
amounts as adjusted for significant items and possibly other items.
Operating income, as adjusted for significant items, also may be used
as a component of Sara Lee’s long-term incentive plans. Many of the
significant items will recur in future periods; however, the amount and
frequency of each significant item varies from period to period. See
Non-GAAP Measures Definitions
in the Financial Review section of this
report for additional information regarding these financial measures.
Summary of Results
The business highlights for 2011 include the following:
• Net sales for the year were $8.7 billion, an increase of
$342 million, or 4.1% over the prior year, as pricing actions in
response to higher commodity costs, the impact of recent acquisi-
tions and changes in foreign currency exchange rates offset the
negative impact of lower unit volumes and the 53rd week in the
prior year. Adjusted net sales increased 4.9 %.
• Reported operating income for the year was $627 million, a
decrease of $194 million, which resulted from the cessation of con-
tingent sales proceeds, lower operating results for the International
Beverage business segment primarily driven by raw material costs
increases and the unfavorable impact of the 53rd week in the prior
year. Adjusted operating income decreased $18 million, or 2.0%.
• Operating segment income was negatively impacted by the
year-over-year increase in commodity costs net of pricing actions
and lower unit volumes. These declines were partially offset by cost
savings achieved from Project Accelerate and continuous improve-
ment initiatives and a 5% decline in spending on media advertising
and promotions (MAP).
• Net income from continuing operations attributable to Sara Lee
was $338 million, or $0.54 per share on a diluted basis, a decline
of $244 million. The year-over-year decline reflects the lower results
for the business segments, the cessation of contingent sale pro-
ceeds, $55 million of debt extinguishment costs and an increase
in income tax expense. Net income attributable to Sara Lee was
$1.287 billion or $2.06 per share on a diluted basis, which includes
a $736 million after tax gain on the sale of businesses.