Sara Lee 2011 Annual Report Download - page 6
Download and view the complete annual report
Please find page 6 of the 2011 Sara Lee annual report below. You can navigate through the pages in the report by either clicking on the pages listed below, or by using the keyword search tool below to find specific information within the annual report.-
 1
1 -
 2
2 -
 3
3 -
 4
4 -
 5
5 -
 6
6 -
 7
7 -
 8
8 -
 9
9 -
 10
10 -
 11
11 -
 12
12 -
 13
13 -
 14
14 -
 15
15 -
 16
16 -
 17
17 -
18
-
19
-
20
-
21
-
22
-
23
-
24
-
25
-
26
-
27
-
28
-
29
-
30
-
31
-
32
-
33
-
34
-
35
-
36
-
37
-
38
-
39
-
40
-
41
-
42
-
43
-
44
-
45
-
46
-
47
-
48
-
49
-
50
-
51
-
52
-
53
-
54
-
55
-
56
-
57
-
58
-
59
-
60
-
61
-
62
-
63
-
64
-
65
-
66
-
67
-
68
-
69
-
70
-
71
-
72
-
73
-
74
-
75
-
76
-
77
-
78
-
79
-
80
-
81
-
82
-
83
-
84
-
85
-
86
-
87
-
88
-
89
-
90
-
91
-
92
-
93
-
94
-
95
-
96
-
97
-
98
-
99
-
100
-
101
-
102
-
103
-
104
-
105
-
106
-
107
-
108
-
109
-
110
-
111
-
112
-
113
-
114
-
115
-
116
-
117
-
118
-
119
-
120
-
121
-
122
-
123
-
124
 |
 |

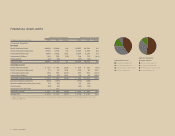
Reported Fiscal Year Results Adjusted Fiscal Year Results1
In millions except per share data 2011 2010 % Change 2011 2010 % Change
Continuing Operations
Net Sales
North American Retail $2,868 $2,818 1.8 $2,857 $2,766 3.3
North American Foodservice 1,566 1,547 1.2 1,566 1,523 2.8
International Beverage 3,548 3,221 10.2 3,514 3,199 9.9
International Bakery 726 785 (7.5) 726 775 (6.4)
Intersegment (27) (32) (27) (32)
Total net sales $8,681 $8,339 4.1 $8,636 $8,231 4.9
Operating Income
North American Retail $÷«307 $÷«343 (10.6) $÷«317 $÷«335 (5.2)
North American Foodservice 79 60 32.8 102 86 19.1
International Beverage 452 592 (23.6) 489 593 (17.5)
International Bakery (12) (14) 10.9 16 45 (65.0)
Operating segment income $÷«826 $÷«981 (15.8) $÷«924 $1,059 (12.6)
General corporate expenses (188) (259) (104) (198)
Mark-to-market derivative gain/(loss) 11 (13) 11 (13)
Amortization (22) (21) (22) (21)
Contingent sale proceeds – 133 – –
Operating income $÷«627 $÷«821 (23.6) $÷«809 $÷«827 (2.0)
Diluted EPS $÷0.54 $÷0.84 (35.7) $÷0.78 $÷0.67 16.4
1“Adjusted” financials are non-GAAP measures and are reconciled to comparable GAAP measures in the Financial section of this report
beginning on page 46.
FINANCIAL HIGHLIGHTS
Adjusted Net Sales
International Beverage 41%
North American Retail 33%
North American Foodservice 18%
International Bakery 8%
4 Sara Lee Corporation
Adjusted Operating
Segment Income
International Beverage 53%
North American Retail 34%
North American Foodservice 11%
International Bakery 2%
4 Sara Lee Corporation