Sara Lee 2011 Annual Report Download - page 54
Download and view the complete annual report
Please find page 54 of the 2011 Sara Lee annual report below. You can navigate through the pages in the report by either clicking on the pages listed below, or by using the keyword search tool below to find specific information within the annual report.-
 1
1 -
2
-
3
-
4
-
5
-
6
-
7
-
8
-
9
-
10
-
11
-
12
-
13
-
14
-
15
-
16
-
17
-
18
-
19
-
20
-
21
-
22
-
23
-
24
-
25
-
26
-
27
-
28
-
29
-
30
-
31
-
32
-
33
-
34
-
35
-
36
-
37
-
38
-
39
-
40
-
41
-
42
-
43
-
 44
44 -
 45
45 -
 46
46 -
 47
47 -
 48
48 -
 49
49 -
 50
50 -
 51
51 -
 52
52 -
 53
53 -
 54
54 -
 55
55 -
 56
56 -
 57
57 -
 58
58 -
 59
59 -
 60
60 -
 61
61 -
 62
62 -
 63
63 -
 64
64 -
65
-
66
-
67
-
68
-
69
-
70
-
71
-
72
-
73
-
74
-
75
-
76
-
77
-
78
-
79
-
80
-
81
-
82
-
83
-
84
-
85
-
86
-
87
-
88
-
89
-
90
-
91
-
92
-
93
-
94
-
95
-
96
-
97
-
98
-
99
-
100
-
101
-
102
-
103
-
104
-
105
-
106
-
107
-
108
-
109
-
110
-
111
-
112
-
113
-
114
-
115
-
116
-
117
-
118
-
119
-
120
-
121
-
122
-
123
-
124
 |
 |

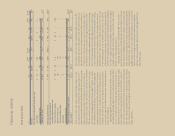
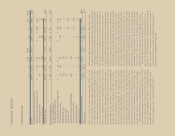
FINANCIAL REVIEW
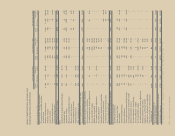
2010 versus 2009
Dollar Percent
In millions 2010 2009 Change Change
Net sales $8,339 $8,366 $÷(27) (0.3) %
Less: Increase/(decrease)
in net sales from
Changes in currency rates $÷÷÷«– $÷(152) $«152
Acquisitions/dispositions 12 143 (131)
Impact of 53rd week 139 – 139
Adjusted net sales $8,188 $8,375 $(187) (2.2) %
Operating income $÷«821 $÷«418 $«403 96.4 %
Less: Increase/(decrease)
in operating income from
Contingent sale proceeds $÷«133 $÷«150 $÷(17)
Changes in currency rates – (17) 17
Project Accelerate/
transformation charges (107) (118) 11
Accelerated depreciation (11) – (11)
Impairment charges (28) (314) 286
Curtailment gain 20 12 8
Gain on property disposition – 14 (14)
Mexican tax indemnification (26) – (26)
Balance sheet corrections – 11 (11)
Acquisitions/dispositions 1 11 (10)
Impact of 53rd week 18 – 18
Adjusted operating income $÷«821 $÷«669 $«152 22.4 %
Net Sales Net sales in 2011 were $8.7 billion, an increase
of $342 million, or 4.1% versus 2010. Net sales were impacted
by changes in foreign currency exchange rates, particularly the
European euro, Brazilian real and Australian dollar, which increased
reported net sales by $32 million; acquisitions net of dispositions
after the beginning of 2010, which increased net sales by $44 million;
and the negative impact of the 53rd week in the prior year, which
decreased net sales by $139 million. Adjusted net sales increased
$405 million, or 4.9% due to price increases in response to higher
commodity costs, a favorable shift in sales mix and higher green
coffee export sales partially offset by lower unit volumes.
Net sales in 2010 were $8.339 billion, a decrease of $27 million,
or 0.3% versus 2009. Net sales were impacted by changes in foreign
currency exchange rates, particularly the European euro, Brazilian
real and Australian dollar, which increased reported net sales by
$152 million; dispositions net of acquisition after the beginning of
2009, which reduced net sales by $131 million; and the impact of
the 53rd week, which increased net sales by $139 million. Adjusted
net sales decreased $187 million, or 2.2% due to lower unit volumes
and price reductions in response to lower commodity costs and
competitive pressures partially offset by an improved sales mix.
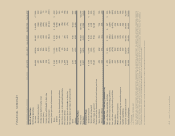
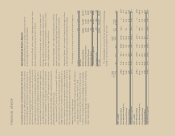
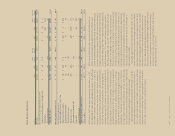
Review of Consolidated Results
The following tables summarize net sales and operating income for
2011 versus 2010, and 2010 versus 2009 and certain items that
affected the comparability of these amounts:
2011 versus 2010
Dollar Percent
In millions 2011 2010 Change Change
Net sales $8,681 $8,339 $«342 4.1 %
Less: Increase/(decrease)
in net sales from
Changes in currency rates $÷÷÷«– $÷««(32) $÷«32
Acquisitions/dispositions 45 1 44
Impact of 53rd week – 139 (139)
Adjusted net sales $8,636 $8,231 $«405 4.9 %
Operating income $÷«627 $÷«821 $(194) (23.6) %
Less: Increase/(decrease)
in operating income from
Contingent sale proceeds $÷÷÷«– $÷«133 $(133)
Changes in currency rates – (5) 5
Project Accelerate charges (21) (107) 86
Spin-off related costs (76) – (76)
Int’l stranded overhead (66) – (66)
Accelerated depreciation (2) (11) 9
Impairment charges (21) (28) 7
Curtailment gain – 20 (20)
Mexican tax indemnification – (26) 26
Acquisitions/dispositions 4–4
Impact of 53rd week – 18 (18)
Adjusted operating income $÷«809 $÷«827 $««(18) (2.0) %