Sara Lee 2011 Annual Report Download - page 118
Download and view the complete annual report
Please find page 118 of the 2011 Sara Lee annual report below. You can navigate through the pages in the report by either clicking on the pages listed below, or by using the keyword search tool below to find specific information within the annual report.-
 1
1 -
2
-
3
-
4
-
5
-
6
-
7
-
8
-
9
-
10
-
11
-
12
-
13
-
14
-
15
-
16
-
17
-
18
-
19
-
20
-
21
-
22
-
23
-
24
-
25
-
26
-
27
-
28
-
29
-
30
-
31
-
32
-
33
-
34
-
35
-
36
-
37
-
38
-
39
-
40
-
41
-
42
-
43
-
44
-
45
-
46
-
47
-
48
-
49
-
50
-
51
-
52
-
53
-
54
-
55
-
56
-
57
-
58
-
59
-
60
-
61
-
62
-
63
-
64
-
65
-
66
-
67
-
68
-
69
-
70
-
71
-
72
-
73
-
74
-
75
-
76
-
77
-
78
-
79
-
80
-
81
-
82
-
83
-
84
-
85
-
86
-
87
-
88
-
89
-
90
-
91
-
92
-
93
-
94
-
95
-
96
-
97
-
98
-
99
-
100
-
101
-
102
-
103
-
104
-
105
-
106
-
107
-
 108
108 -
 109
109 -
 110
110 -
 111
111 -
 112
112 -
 113
113 -
 114
114 -
 115
115 -
 116
116 -
 117
117 -
 118
118 -
 119
119 -
 120
120 -
 121
121 -
 122
122 -
 123
123 -
 124
124
 |
 |

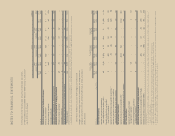
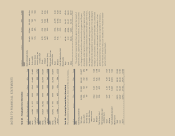
NOTES TO FINANCIAL STATEMENTS
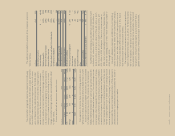
In millions Quarter First Second Third Fourth
2010
Continuing operations
Net sales $1,969 $2,262 $1,995 $2,113
Gross profit 687 835 752 709
Income (loss) 176 285 13 108
Income (loss) per
common share
Basic 0.25 0.41 0.02 0.16
Diluted 0.25 0.41 0.02 0.16
Net income (loss) 287 376 (328) 192
Net income (loss) per
common share
Basic 0.41 0.53 (0.49) 0.28
Diluted 0.41 0.53 (0.49) 0.28
Cash dividends declared – 0.11 0.11 0.22
Market price
High 11.36 12.61 14.17 15.08
Low 9.17 10.64 11.67 12.83
Close 11.21 12.45 13.74 13.99
The quarterly financial data shown above includes the impact of
significant items. Significant items may include, but are not limited
to: charges for exit activities; transformation program and Project
Accelerate costs; spin-off costs; impairment charges; pension partial
withdrawal liability charges; benefit plan curtailment gains and losses;
tax charges on deemed repatriated earnings; tax costs and benefits
resulting from the disposition of a business; impact of tax law changes;
changes in tax valuation allowances and favorable or unfavorable
resolution of open tax matters based on the finalization of tax
authority examinations or the expiration of statutes of limitations.
Further details of these items are included in the Financial Review
section of the Annual Report.
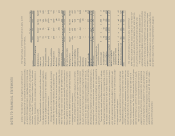
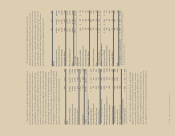
Note 20 – Geographic Area Information
In millions United States Netherlands Spain France Other Total
2011
Sales $4,383 $÷«977 $555 $562 $2,204 $8,681
Long-lived
assets 1,460 302 188 346 485 2,781
2010
Sales $4,315 $1,001 $607 $509 $1,907 $8,339
Long-lived
assets 1,447 274 180 294 363 2,558
2009
Sales $4,501 $÷«987 $649 $526 $1,703 $8,366
Long-lived
assets 1,482 345 244 316 386 2,773
Note 21 – Quarterly Financial Data (Unaudited)
The corporation’s quarterly results for 2011 and 2010 are as follows:
In millions Quarter First Second Third Fourth
2011
Continuing operations
Net sales $1,988 $2,254 $2,142 $2,297
Gross profit 646 763 710 694
Income (loss) 64 96 130 48
Income (loss) per
common share
Basic 0.10 0.15 0.21 0.08
Diluted 0.10 0.15 0.21 0.08
Net income (loss) 194 833 156 113
Net income (loss) per
common share
Basic 0.29 1.30 0.25 0.19
Diluted 0.29 1.30 0.25 0.19
Cash dividends declared – 0.115 0.115 0.23
Market price
High 15.40 17.72 20.26 19.80
Low 13.22 14.00 16.45 17.87
Close 13.43 17.51 17.90 19.32