Sara Lee 2011 Annual Report Download - page 55
Download and view the complete annual report
Please find page 55 of the 2011 Sara Lee annual report below. You can navigate through the pages in the report by either clicking on the pages listed below, or by using the keyword search tool below to find specific information within the annual report.-
 1
1 -
2
-
3
-
4
-
5
-
6
-
7
-
8
-
9
-
10
-
11
-
12
-
13
-
14
-
15
-
16
-
17
-
18
-
19
-
20
-
21
-
22
-
23
-
24
-
25
-
26
-
27
-
28
-
29
-
30
-
31
-
32
-
33
-
34
-
35
-
36
-
37
-
38
-
39
-
40
-
41
-
42
-
43
-
44
-
 45
45 -
 46
46 -
 47
47 -
 48
48 -
 49
49 -
 50
50 -
 51
51 -
 52
52 -
 53
53 -
 54
54 -
 55
55 -
 56
56 -
 57
57 -
 58
58 -
 59
59 -
 60
60 -
 61
61 -
 62
62 -
 63
63 -
 64
64 -
 65
65 -
66
-
67
-
68
-
69
-
70
-
71
-
72
-
73
-
74
-
75
-
76
-
77
-
78
-
79
-
80
-
81
-
82
-
83
-
84
-
85
-
86
-
87
-
88
-
89
-
90
-
91
-
92
-
93
-
94
-
95
-
96
-
97
-
98
-
99
-
100
-
101
-
102
-
103
-
104
-
105
-
106
-
107
-
108
-
109
-
110
-
111
-
112
-
113
-
114
-
115
-
116
-
117
-
118
-
119
-
120
-
121
-
122
-
123
-
124
 |
 |

52/53 Sara Lee Corporation and Subsidiaries
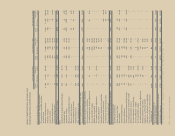
Volume Impact
(Excl. 53rd of 53rd Acq./ Foreign
Week) Mix Price Other Week Disp. Exchange Total
2011 versus 2010 (4.7) % 2.5% 5.6 % 1.5 % (1.7) % 0.5 % 0.4% 4.1 %
2010 versus 2009 (3.9) % 3.0% (1.0) % (0.3) % 1.7 % (1.6) % 1.8% (0.3) %
The following table summarizes the components of the
change in sales on a percentage basis versus the prior year:
Net Sales Bridge – Components of Change vs Prior Year
Operating Income Operating income decreased by $194 million,
or 23.6% in 2011. The year-over-year net impact of the change in
contingent sales proceeds, currency rates, transformation/Project
Accelerate charges, impairment charges, and the other factors
identified in the preceding table decreased operating income by
$176 million. As a result, adjusted operating income decreased
$18 million, or 2.0% due to the decline in adjusted operating results
for the business segments, primarily International Beverage, partially
offset by the favorable impact of a $24 million improvement in
unrealized commodity mark-to-market derivatives and a significant
decline in general corporate expenses.
Operating income increased by $403 million, or 96.4% in 2010.
The year-over-year net impact of the changes in currency rates,
Project Accelerate/transformation charges, impairment charges and
the other factors identified in the preceding table increased operat-
ing income by $251 million. Adjusted operating income increased
$152 million, or 22.4% due to lower commodity costs, the benefits
of cost saving initiatives, and an improved sales mix partially offset
by lower unit volumes and higher MAP spending.
The changes in the individual components of operating income
are discussed in more detail below.
Gross Margin The gross margin, which represents net sales less
cost of sales, decreased by $170 million in 2011, driven by the
negative impact of higher commodity costs net of pricing actions,
lower unit volumes and the impact of the 53rd week, partially offset
by the benefits of cost saving initiatives and an improved sales mix.
The gross margin percent decreased from 35.8% in 2010 to
32.4% in 2011 due to gross margin percent declines for all business
segments but primarily at International Beverage. The gross margin
percent was negatively impacted by higher commodity costs which
were partially offset by pricing actions, a favorable shift in product
mix and continuous improvement savings.
The gross margin increased by $231 million in 2010 compared to
2009, driven by lower commodity costs, the benefits of cost saving
initiatives, the favorable impact of changes in currency exchange rates,
an improved sales mix and the impact of the 53rd week, partially
offset by the impact of lower unit volumes and lower prices.
The gross margin percent increased from 32.9% in 2009 to
35.8% in 2010 due to gross margin percent improvements for all
business segments but primarily at North American Retail and
International Beverage. The gross margin percent was positively
impacted by lower commodity costs, a favorable shift in product mix
and continuous improvement savings, which were partially offset by
pricing actions and the negative impact of inflation on labor and
other employee benefit costs.
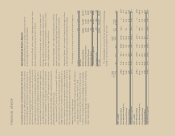
Selling, General and Administrative Expenses
In millions 2011 2010 2009
SG&A expenses in the business
segment results
Media advertising and promotion $÷«323 $÷«340 $÷«279
Other 1,561 1,571 1,552
Total business segments 1,884 1,911 1,831
Amortization of identifiable intangibles 22 21 21
General corporate expenses 155 246 213
Mark-to-market derivative
(gains)/losses (1)57
Total SG&A $2,060 $2,183 $2,072
Total selling, general and administrative (SG&A) expenses in
2011 decreased $123 million, or 5.6%. Changes in foreign currency
exchange rates, primarily in the European euro, decreased SG&A
expenses by $5 million, or 0.2%. The remaining decrease in SG&A
expenses was $118 million, or 5.4%. Measured as a percent of
sales, SG&A expenses decreased from 26.2% in 2010 to 23.7% in
2011. SG&A expenses as a percent of sales decreased in each of
the business segments, with the exception of International Bakery.
The results reflect the impact of lower MAP expenses and the
benefits of cost saving initiatives.