Sara Lee 2011 Annual Report Download - page 57
Download and view the complete annual report
Please find page 57 of the 2011 Sara Lee annual report below. You can navigate through the pages in the report by either clicking on the pages listed below, or by using the keyword search tool below to find specific information within the annual report.-
 1
1 -
2
-
3
-
4
-
5
-
6
-
7
-
8
-
9
-
10
-
11
-
12
-
13
-
14
-
15
-
16
-
17
-
18
-
19
-
20
-
21
-
22
-
23
-
24
-
25
-
26
-
27
-
28
-
29
-
30
-
31
-
32
-
33
-
34
-
35
-
36
-
37
-
38
-
39
-
40
-
41
-
42
-
43
-
44
-
45
-
46
-
 47
47 -
 48
48 -
 49
49 -
 50
50 -
 51
51 -
 52
52 -
 53
53 -
 54
54 -
 55
55 -
 56
56 -
 57
57 -
 58
58 -
 59
59 -
 60
60 -
 61
61 -
 62
62 -
 63
63 -
 64
64 -
 65
65 -
 66
66 -
 67
67 -
68
-
69
-
70
-
71
-
72
-
73
-
74
-
75
-
76
-
77
-
78
-
79
-
80
-
81
-
82
-
83
-
84
-
85
-
86
-
87
-
88
-
89
-
90
-
91
-
92
-
93
-
94
-
95
-
96
-
97
-
98
-
99
-
100
-
101
-
102
-
103
-
104
-
105
-
106
-
107
-
108
-
109
-
110
-
111
-
112
-
113
-
114
-
115
-
116
-
117
-
118
-
119
-
120
-
121
-
122
-
123
-
124
 |
 |

54/55 Sara Lee Corporation and Subsidiaries
Net Interest Expense Net interest expense decreased by $30 million
in 2011 to $85 million. The decrease in net interest expense was a
result of a $21 million decline in interest expense due to the result
of refinancing approximately $800 million of debt at lower interest
rates earlier in the fiscal year and a $9 million increase in interest
income resulting from an increase in the amount of investments result-
ing from the receipt of divestiture proceeds. Net interest expense
decreased by $5 million in 2010 to $115 million. The decrease in
net interest expense was a result of a $23 million decline in interest
expense due to lower interest rates and average debt levels partially
offset by a $18 million decrease in interest income resulting from
a lower rate of return earned on investments.
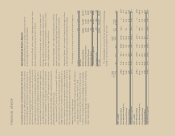
Income Tax Expense The effective tax rate on continuing operations
in 2011, 2010 and 2009 was impacted by a number of significant
items that are shown in the reconciliation of the corporation’s effec-
tive tax rate to the U.S. statutory rate in Note 18 to the Consolidated
Financial Statements. Additional information regarding income taxes
can be found in “Critical Accounting Estimates” within Management’s
Discussion and Analysis.
In millions 2011 2010 2009
Continuing operations
Income before income taxes $487 $706 $298
Income tax expense 149 124 114
Effective tax rates 30.7% 17.6% 38.4%
2011 vs. 2010
In 2011, the corporation recognized tax expense
on continuing operations of $149 million, or an effective tax rate of
30.7%, compared to tax expense of $124 million, or an effective tax
rate of 17.6%, in 2010. The significant components impacting the
change in the corporation’s 2011 effective tax rate are as follows:
• Remittance of Foreign Earnings – The 2011 effective tax rate was
16 percentage points lower than 2010 primarily due to a tax charge
in 2010 of $145 million related to 2010 foreign earnings that are no
longer indefinitely reinvested. Of this total, $121 million was a charge
in connection with the corporation’s decision to no longer reinvest
overseas earnings primarily attributable to existing overseas cash
and the book value of the household and body care businesses.
The corporation expects to incur charges in future fiscal years from
the remittance of foreign earnings. See the discussion of
Repatriation
of Foreign Earnings and Income Taxes
in the Liquidity section of
Management’s Discussion and Analysis for more information.
The corporation has recognized approximately $262 million
of total charges related to Project Accelerate through the end of
2011, which represents virtually all of the charges expected to be
recognized under this program. For 2011, the savings resulting from
Project Accelerate and other restructuring actions were approximately
$232 million, of which approximately $87 million is incremental
to the prior year.
Impairment Charges In 2011, the corporation recognized a
$21 million impairment charge, $15 million of which related to the
writedown of manufacturing equipment associated with the North
American foodservice bakery reporting unit and $6 million related
to the writedown of manufacturing equipment associated with the
International Beverage segment.
In 2010, the corporation recognized a $28 million impairment
charge, $15 million of which related to the writedown of manufac-
turing equipment associated with the North American foodservice
bakery reporting unit and $13 million of which related to the write-
down of bakery equipment associated with the Spanish bakery
reporting unit.
During 2009, the corporation recognized a $314 million non-cash
charge primarily for the impairment of goodwill and other long-lived
assets associated with the Spanish bakery operations and goodwill
associated with the North American foodservice beverage opera-
tions as both operations were not expected to generate sufficient
profitability to support the remaining goodwill balances.
Additional details regarding these impairment charges are
discussed in Note 4 to the Consolidated Financial Statements,
“Impairment Charges.”
Receipt of Contingent Sale Proceeds Under the terms of the sale
agreement for its cut tobacco business sold in 1999, the corporation
was to receive annual cash payments of 95 million euros through
July 2009, contingent on tobacco continuing to be a legal product
in the Netherlands, Germany and Belgium. As tobacco continued
to be a legal product in the required countries through the final
payment date, the U.S. dollar amounts received in 2010 and 2009
were $133 million and $150 million, respectively. These amounts
were recognized in the corporation’s earnings when received and
the payments increased diluted earnings per share from continuing
operations in 2010 and 2009 by $0.19 and $0.21, respectively.