Sara Lee 2011 Annual Report Download - page 101
Download and view the complete annual report
Please find page 101 of the 2011 Sara Lee annual report below. You can navigate through the pages in the report by either clicking on the pages listed below, or by using the keyword search tool below to find specific information within the annual report.-
 1
1 -
2
-
3
-
4
-
5
-
6
-
7
-
8
-
9
-
10
-
11
-
12
-
13
-
14
-
15
-
16
-
17
-
18
-
19
-
20
-
21
-
22
-
23
-
24
-
25
-
26
-
27
-
28
-
29
-
30
-
31
-
32
-
33
-
34
-
35
-
36
-
37
-
38
-
39
-
40
-
41
-
42
-
43
-
44
-
45
-
46
-
47
-
48
-
49
-
50
-
51
-
52
-
53
-
54
-
55
-
56
-
57
-
58
-
59
-
60
-
61
-
62
-
63
-
64
-
65
-
66
-
67
-
68
-
69
-
70
-
71
-
72
-
73
-
74
-
75
-
76
-
77
-
78
-
79
-
80
-
81
-
82
-
83
-
84
-
85
-
86
-
87
-
88
-
89
-
90
-
 91
91 -
 92
92 -
 93
93 -
 94
94 -
 95
95 -
 96
96 -
 97
97 -
 98
98 -
 99
99 -
 100
100 -
 101
101 -
 102
102 -
 103
103 -
 104
104 -
 105
105 -
 106
106 -
 107
107 -
 108
108 -
 109
109 -
 110
110 -
 111
111 -
112
-
113
-
114
-
115
-
116
-
117
-
118
-
119
-
120
-
121
-
122
-
123
-
124
 |
 |

As of July 2, 2011, the corporation had $30 million of total
unrecognized compensation expense related to stock unit plans
that will be recognized over the weighted average period of 1.77
years, which does not include the potential impact of the spin-off.
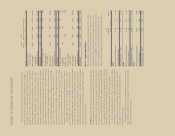
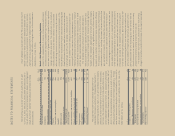
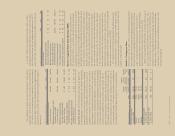
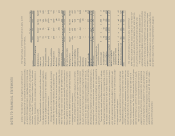
In millions except per share data 2011 2010 2009
Stock Unit Awards
Fair value of share-based units
that vested during the fiscal year $«÷÷42 $÷÷«35 $÷÷«12
Weighted average grant date
fair value of share based units
granted during the fiscal year $15.13 $10.06 $13.73
All Stock-Based Compensation
Total compensation expense $«÷÷41 $÷÷«35 $÷÷«41
Tax benefit on compensation expense $÷«÷15 $÷÷«13 $÷÷«12
Note 10 – Employee Stock Ownership Plans (ESOP)
The corporation maintains an ESOP that holds common stock of
the corporation that is used to fund a portion of the corporation’s
matching program for its 401(k) savings plan for domestic non-union
employees. The purchase of the original stock by the Sara Lee ESOP
was funded both with debt guaranteed by the corporation and loans
from the corporation. The debt guaranteed by the corporation was
fully paid in 2004, and only loans from the corporation to the ESOP
remain. Each year, the corporation makes contributions that, with
the dividends on the common stock held by the Sara Lee ESOP,
are used to pay loan interest and principal. Shares are allocated to
participants based upon the ratio of the current year’s debt service
to the sum of the total principal and interest payments over the
remaining life of the loan. The number of unallocated shares in the
ESOP was 6 million at July 2, 2011 and 7 million at July 3, 2010.
Expense recognition for the ESOP is accounted for under the grandfa-
thered provisions contained within US GAAP.
The expense for the 401(k) recognized by the ESOP amounted
to $15 million in 2011, $7 million in 2010 and $5 million in 2009.
Payments to the Sara Lee ESOP were $23 million in 2011 and $11
million in 2010 and 2009.
Note 11 – Earnings per Share
Net income (loss) per share – basic is computed by dividing income
(loss) attributable to Sara Lee by the weighted average number of
common shares outstanding for the period. Net income (loss) per
share – diluted reflects the potential dilution that could occur if
options and fixed awards to be issued under stock-based compen-
sation arrangements were converted into common stock.
Options to purchase 8.4 million shares of common stock at July 2,
2011, 16.1 million shares of common stock at July 3, 2010 and
27.7 million shares of common stock at June 27, 2009 were not
included in the computation of diluted earnings per share because
the exercise price of these options was greater than the average
market price of the corporation’s outstanding common stock, and
therefore anti-dilutive.
The corporation received cash from the exercise of stock options
during 2011 of $51 million. As of July 2, 2011, the corporation had
$7.3 million of total unrecognized compensation expense related to
stock option plans that will be recognized over the weighted average
period of 1.0 years, which does not include the potential impact of
the spin-off.
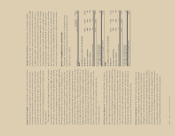
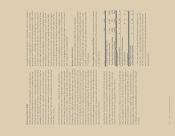
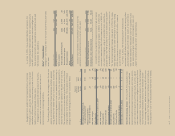
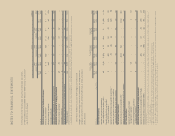
In millions except per share data 2011 2010 2009
Number of options exercisable
at end of fiscal year 12,041 13,121 22,721
Weighted average exercise price
of options exercisable
at end of fiscal year $17.06 $17.66 $18.13
Weighted average grant date
fair value of options granted
during the fiscal year $÷3.42 $÷1.88 $÷2.67
Total intrinsic value of options
exercised during the fiscal year $÷÷8.0 $÷÷0.9 $÷÷0.0
Fair value of options that vested
during the fiscal year $÷÷4.5 $÷÷6.3 $÷÷2.0
Stock Unit Awards Restricted stock units (RSUs) are granted to
certain employees to incent performance and retention over periods
ranging from one to five years. Upon the achievement of defined
parameters, the RSUs are generally converted into shares of the
corporation’s common stock on a one-for-one basis and issued to
the employees. A substantial portion of all RSUs vest solely upon
continued future service to the corporation. A small portion of RSUs
vest based upon continued future employment and the achievement
of certain defined performance measures. The cost of these awards
is determined using the fair value of the shares on the date of
grant, and compensation is recognized over the period during which
the employees provide the requisite service to the corporation. All
RSU’s will immediately vest upon the completion of the spin-off. A
summary of the changes in the stock unit awards outstanding under
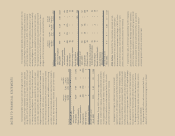
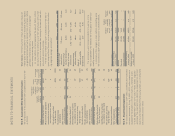
the corporation’s benefit plans during 2011 is presented below:
Weighted
Weighted Average Aggregate
Average Remaining Intrinsic
Grant Date Contractual Value
Shares in thousands Shares Fair Value Term (Years) (in millions)
Nonvested share units
at July 3, 2010 9,014 $12.86 1.2 $126
Granted 2,514 15.13 – –
Vested (2,858) 14.57 – –
Forfeited (947) 14.49 – –
Nonvested share units
at July 2, 2011 7,723 $12.76 1.1 $149
Exercisable share units
at July 2, 2011 181 $16.20 2.9 $÷÷4
98/99 Sara Lee Corporation and Subsidiaries