Sara Lee 2011 Annual Report Download - page 66
Download and view the complete annual report
Please find page 66 of the 2011 Sara Lee annual report below. You can navigate through the pages in the report by either clicking on the pages listed below, or by using the keyword search tool below to find specific information within the annual report.-
 1
1 -
2
-
3
-
4
-
5
-
6
-
7
-
8
-
9
-
10
-
11
-
12
-
13
-
14
-
15
-
16
-
17
-
18
-
19
-
20
-
21
-
22
-
23
-
24
-
25
-
26
-
27
-
28
-
29
-
30
-
31
-
32
-
33
-
34
-
35
-
36
-
37
-
38
-
39
-
40
-
41
-
42
-
43
-
44
-
45
-
46
-
47
-
48
-
49
-
50
-
51
-
52
-
53
-
54
-
55
-
 56
56 -
 57
57 -
 58
58 -
 59
59 -
 60
60 -
 61
61 -
 62
62 -
 63
63 -
 64
64 -
 65
65 -
 66
66 -
 67
67 -
 68
68 -
 69
69 -
 70
70 -
 71
71 -
 72
72 -
 73
73 -
 74
74 -
 75
75 -
 76
76 -
77
-
78
-
79
-
80
-
81
-
82
-
83
-
84
-
85
-
86
-
87
-
88
-
89
-
90
-
91
-
92
-
93
-
94
-
95
-
96
-
97
-
98
-
99
-
100
-
101
-
102
-
103
-
104
-
105
-
106
-
107
-
108
-
109
-
110
-
111
-
112
-
113
-
114
-
115
-
116
-
117
-
118
-
119
-
120
-
121
-
122
-
123
-
124
 |
 |

FINANCIAL REVIEW
Financial Condition
The corporation’s cash flow statements include amounts related to
discontinued operations through the date of disposal. The discon-
tinued operations had a significant impact on the cash flows from
operating, investing and financing activities in each fiscal year.
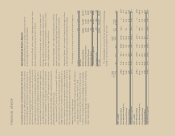
Cash from Operating Activities The cash from operating activities
generated by continuing and discontinued operations is summarized
in the following table:
2011 2010 2009
Cash from operating activities
Continuing operations $226 $454 $321
Discontinued operations 221 498 579
Total $447 $952 $900
2011 versus 2010
The decrease in cash from operating activities
of $505 million in 2011 was due primarily to a decline in the cash
generated by discontinued operations resulting from the completion
of the business dispositions. The cash generated by continuing oper-
ations declined as a result of the lower operating results, increased
working capital usage with respect to inventories and an increase in
cash paid for restructuring actions, which were partially offset by a
decrease in cash payments for taxes as well as lower contributions
to pension plans.
2010 versus 2009
The increase in cash from operating activities
of $52 million in 2010 was due primarily to improved operating
results and better working capital management with respect to
accounts payable and accounts receivable, which were partially
offset by an increase in cash payments for restructuring actions
and taxes as well as higher contributions to pension plans as
compared to the prior year.
Cash from (used in) Investing Activities Net cash from (used in)
investing activities is split between continuing and discontinued
operations as follows:
2011 2010 2009
Cash from (used in) investment activities
Continuing operations $÷(317) $(171) $(181)
Discontinued operations 2,446 119 (105)
Total $2,129 $÷(52) $(286)
2011 versus 2010
In 2011, the cash from investing activities
increased by $2.2 billion over the prior year due to a $2.3 billion
increase in cash proceeds received from the disposition of busi-
nesses and a $107 million increase in cash received from
derivative transactions.
The corporation received $2.3 billion in 2011 primarily related
to the disposition of the majority of the household and body care
businesses while it received $204 million in 2010, primarily related
to the sale of its insecticide business in India. In 2009, it received
$53 million, of which $42 million was related to the disposition
of its DSD foodservice operations. In 2011, the corporation also
received a $203 million deposit related to the disposition of its
insecticides businesses.
The corporation expended $119 million of cash for the acquisition
of two businesses during 2011, Aidells, a retail sausage business
and Damasco, a Brazilian coffee company.
In 2011, $81 million of cash was received from derivative
transactions, as compared to cash used of $26 million in 2010,
which related primarily to hedges of foreign currency exposures.
The corporation spent $355 million for the purchase of property,
equipment, computer software and intangibles in 2011 as compared
to $385 million in 2010. The slightly higher level of spending in
2010 was to expand meat production capacity in North American
Retail and to implement new software to improve North American
operations. The corporation expects capital expenditures for property
and equipment to be approximately $370 million in 2012, a slight
increase over 2011 due to planned capacity expansion, investment
behind product innovations and the impact of changes foreign
currency rates.
Cash from investing activities was negatively impacted by the
cessation of contingent sale proceeds as the $133 million received
in 2010 represented the final payment that was to be received.
2010 versus 2009
The cash used in investing activities in 2010
declined by $234 million from the prior year due primarily to a
$151 million increase in cash proceeds received from the dispo-
sition of businesses and a $112 million reduction in cash used
in derivative transactions.
The corporation received $204 million in 2010, primarily related
to the sale of its insecticide business in India. In 2009, it received
$53 million, of which $42 million was related to the disposition of
its DSD foodservice operations.
In 2010, $26 million of cash was used for derivative transactions,
as compared to $138 million in 2009, primarily driven by hedges
of foreign currency exposures.
The corporation spent $385 million for the purchase of property,
equipment, computer software and intangibles in 2010 as compared
to $379 million in 2009. The slightly higher level of spending in 2010
was to expand meat production capacity in North American Retail and
to implement new software to improve North American operations.