Sara Lee 2011 Annual Report Download - page 61
Download and view the complete annual report
Please find page 61 of the 2011 Sara Lee annual report below. You can navigate through the pages in the report by either clicking on the pages listed below, or by using the keyword search tool below to find specific information within the annual report.-
 1
1 -
2
-
3
-
4
-
5
-
6
-
7
-
8
-
9
-
10
-
11
-
12
-
13
-
14
-
15
-
16
-
17
-
18
-
19
-
20
-
21
-
22
-
23
-
24
-
25
-
26
-
27
-
28
-
29
-
30
-
31
-
32
-
33
-
34
-
35
-
36
-
37
-
38
-
39
-
40
-
41
-
42
-
43
-
44
-
45
-
46
-
47
-
48
-
49
-
50
-
 51
51 -
 52
52 -
 53
53 -
 54
54 -
 55
55 -
 56
56 -
 57
57 -
 58
58 -
 59
59 -
 60
60 -
 61
61 -
 62
62 -
 63
63 -
 64
64 -
 65
65 -
 66
66 -
 67
67 -
 68
68 -
 69
69 -
 70
70 -
 71
71 -
72
-
73
-
74
-
75
-
76
-
77
-
78
-
79
-
80
-
81
-
82
-
83
-
84
-
85
-
86
-
87
-
88
-
89
-
90
-
91
-
92
-
93
-
94
-
95
-
96
-
97
-
98
-
99
-
100
-
101
-
102
-
103
-
104
-
105
-
106
-
107
-
108
-
109
-
110
-
111
-
112
-
113
-
114
-
115
-
116
-
117
-
118
-
119
-
120
-
121
-
122
-
123
-
124
 |
 |

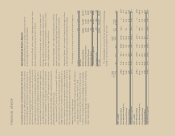
58/59 Sara Lee Corporation and Subsidiaries
Operating segment income and income from continuing operations
before income taxes for 2011, 2010 and 2009 are as follows:
In millions 2011 2010 2009
Income from continuing operations
before income taxes
North American Retail $«307 $«343 $«247
North American Foodservice 79 60 (20)
International Beverage 452 592 493
International Bakery (12) (14) (194)
Total operating segment income 826 981 526
General corporate expenses (188) (259) (225)
Mark-to-market derivative gains/(losses) 11 (13) (12)
Amortization of intangibles (22) (21) (21)
Contingent sale proceeds – 133 150
Total operating income 627 821 418
Interest expense, net (85) (115) (120)
Debt extinguishment costs (55) – –
Income from continuing operations
before income taxes $«487 $«706 $«298
A discussion of each business segment’s sales and operating
segment income is presented on the following pages. The change
in unit volumes for each business segment excludes the impact
of acquisitions and dispositions and the impact of the 53rd week
in 2010.
General corporate expenses, which are not allocated to the
individual business segments, were $188 million in 2011, a
decrease of $71 million over the prior year. The decrease versus
the prior year was due primarily to a reduction in information tech-
nology costs, the impact of headcount reductions, lower employee
benefit costs, lower franchise taxes and a gain on the disposition
of the corporate jet.
General corporate expenses were $259 million in 2010, an
increase of $34 million over the previous year due primarily to a
$26 million tax indemnification charge as well as a $10 million
increase in restructuring related charges in 2010 and the nega-
tive impact of $22 million of gains in the prior year, which were
partially offset by lower fringe benefit costs and the impact of
headcount reductions.
The corporation uses derivative financial instruments to manage
its exposure to commodity prices. A commodity derivative not declared
a hedge in accordance with the accounting rules is accounted for
under mark-to-market accounting with changes in fair value recorded
in the Consolidated Statements of Income. The corporation includes
these unrealized mark-to-market gains and losses in general corpo-
rate expenses until such time that the exposure being hedged affects
the earnings of the business segment. At that time, the cumulative
gain or loss previously recorded in general corporate expenses for
the derivative instrument will be reclassified into the business
segment’s results.
The unrealized mark-to-market gain/loss incurred on commodity
derivative contracts was a gain of $11 million in 2011 as compared to
a loss of $13 million in 2010 and a loss of $12 million in 2009. The
unrealized mark-to-market gains in 2011 related to commodity deriv-
ative contracts primarily associated with coffee and energy contracts.
The amortization of intangibles in the table relates to acquired
trademarks and customer relationships. It does not include soft-
ware amortization, a portion of which is recognized in the earnings
of the segments and a portion is recognized as part of general
corporate expenses.
The impact of the costs related to exit activities and asset and
business dispositions, transformation and Project Accelerate costs,
impairment charges and other significant items on the corporation’s
business segments and general corporate expenses are summa-
rized as follows:
Summary of Significant Items by Business Segment
In millions 2011 2010 2009
North American Retail $««11 $÷«(3) $÷÷–
North American Foodservice 23 27 106
International Beverage 40 12 27
International Bakery 28 60 245
Impact on the business segments 102 96 378
General corporate expenses 84 56 17
Debt extinguishment costs 55––
Impact on income from continuing
operations before income taxes $241 $152 $395
The most significant charges in the above table relate to
severance charges related to restructuring actions and the spin-off.
In addition, in 2009, impairment charges of $107 million and
$207 million were recognized in North American Foodservice and
International Bakery, respectively. Additional information regarding
the amount and nature of the above charges is provided in the
individual business segment discussions that follow.