Sara Lee 2011 Annual Report Download - page 100
Download and view the complete annual report
Please find page 100 of the 2011 Sara Lee annual report below. You can navigate through the pages in the report by either clicking on the pages listed below, or by using the keyword search tool below to find specific information within the annual report.-
 1
1 -
2
-
3
-
4
-
5
-
6
-
7
-
8
-
9
-
10
-
11
-
12
-
13
-
14
-
15
-
16
-
17
-
18
-
19
-
20
-
21
-
22
-
23
-
24
-
25
-
26
-
27
-
28
-
29
-
30
-
31
-
32
-
33
-
34
-
35
-
36
-
37
-
38
-
39
-
40
-
41
-
42
-
43
-
44
-
45
-
46
-
47
-
48
-
49
-
50
-
51
-
52
-
53
-
54
-
55
-
56
-
57
-
58
-
59
-
60
-
61
-
62
-
63
-
64
-
65
-
66
-
67
-
68
-
69
-
70
-
71
-
72
-
73
-
74
-
75
-
76
-
77
-
78
-
79
-
80
-
81
-
82
-
83
-
84
-
85
-
86
-
87
-
88
-
89
-
 90
90 -
 91
91 -
 92
92 -
 93
93 -
 94
94 -
 95
95 -
 96
96 -
 97
97 -
 98
98 -
 99
99 -
 100
100 -
 101
101 -
 102
102 -
 103
103 -
 104
104 -
 105
105 -
 106
106 -
 107
107 -
 108
108 -
 109
109 -
 110
110 -
111
-
112
-
113
-
114
-
115
-
116
-
117
-
118
-
119
-
120
-
121
-
122
-
123
-
124
 |
 |

NOTES TO FINANCIAL STATEMENTS
Stock Options The exercise price of each stock option equals the
market price of the corporation’s stock on the date of grant. Options
can generally be exercised over a maximum term of 10 years. Options
generally cliff vest and expense is recognized on a straightline
basis during the vesting period.
All stock options will be impacted by the spin-off. Option holders
will have a choice to continue to hold their options pursuant to their
normal terms or to accelerate their vesting on the spin-off date with
a six month window to exercise.
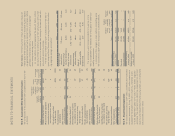
The fair value of each option grant is estimated on the date of
grant using the Black-Scholes option-pricing model and the follow-
ing weighted average assumptions:
2011 2010 2009
Weighted average
expected lives 7.2 years 8.0 years 8.0 years
Weighted average
risk-free interest rates 2.08% 3.03% 3.1%
Range of risk-free
interest rates 1.91 – 2.66% 3.02 – 3.15% 3.1%
Weighted average
expected volatility 28.0% 27.2% 22.1%
Range of
expected volatility 27.3 – 30.0% 27.2 – 27.6% 22.1%
Dividend yield 2.9% 4.4% 3.0%
The corporation uses historical volatility for a period of time
that is comparable to the expected life of the option to determine
volatility assumptions.
A summary of the changes in stock options outstanding under
the corporation’s option plans during 2011 is presented below:
Weighted
Weighted Average Aggregate
Average Remaining Intrinsic
Exercise Contractual Value
Shares in thousands Shares Price Term (Years) (in millions)
Options outstanding
at July 3, 2010 20,036 $15.79 4.7 $16
Granted 2,318 15.49 – –
Exercised (3,106) 16.41 – –
Canceled/expired (1,436) 14.67 – –
Options outstanding
at July 2, 2011 17,812 $15.73 4.6 $66
Options exercisable
at July 2, 2011 12,041 $17.06 2.9 $29
Note 8 – Accumulated Other Comprehensive Income
The components of accumulated other comprehensive income are
as follows:
Net Unrealized
Gain (Loss) Pension/
on Qualifying Post- Accumulated
Cumulative Cash Flow retirement Other
Translation Hedges Liability Comprehensive
In millions Adjustment and Other Adjustment Income (Loss)
Balance at June 28, 2008 $«539 $«21 $(411) $«149
Measurement date adjustment ––3 3
Amortization of net actuarial
loss and prior service credit ––1 1
Net actuarial loss arising
during the period – – (299) (299)
Postretirement plan
amendments – – 55 55
Other comprehensive
income (loss) activity (561) (32) 79 (514)
Balance at June 27, 2009 (22) (11) (572) (605)
Disposition of Godrej J.V. 14 – – 14
Amortization of net actuarial
loss and prior service credit – – 19 19
Net actuarial loss arising
during the period – – (323) (323)
Pension plan curtailment – – 27 27
Pension and postretirement
plan amendments – – (4) (4)
Other comprehensive
income (loss) activity (96) 10 46 (40)
Balance at July 3, 2010 (104) (1) (807) (912)
Disposition of Household &
Body Care businesses 55 – – 55
Amortization of net actuarial
loss and prior service credit – – 16 16
Net actuarial gain arising
during the period – – 326 326
Pension plan curtailment – – 25 25
Other comprehensive
income (loss) activity 277 7 (50) 234
Balance at July 2, 2011 $«228 $÷«6 $(490) $(256)
Note 9 – Stock-Based Compensation
The corporation has various stock option, employee stock purchase
and stock award plans. At July 2, 2011, 101.9 million shares were
available for future grant in the form of options, restricted shares
or stock appreciation rights out of 118.7 million shares originally
authorized. The corporation will satisfy the requirement for common
stock for share-based payments by issuing shares out of authorized
but unissued common stock.