Sara Lee 2011 Annual Report Download - page 56
Download and view the complete annual report
Please find page 56 of the 2011 Sara Lee annual report below. You can navigate through the pages in the report by either clicking on the pages listed below, or by using the keyword search tool below to find specific information within the annual report.-
 1
1 -
2
-
3
-
4
-
5
-
6
-
7
-
8
-
9
-
10
-
11
-
12
-
13
-
14
-
15
-
16
-
17
-
18
-
19
-
20
-
21
-
22
-
23
-
24
-
25
-
26
-
27
-
28
-
29
-
30
-
31
-
32
-
33
-
34
-
35
-
36
-
37
-
38
-
39
-
40
-
41
-
42
-
43
-
44
-
45
-
 46
46 -
 47
47 -
 48
48 -
 49
49 -
 50
50 -
 51
51 -
 52
52 -
 53
53 -
 54
54 -
 55
55 -
 56
56 -
 57
57 -
 58
58 -
 59
59 -
 60
60 -
 61
61 -
 62
62 -
 63
63 -
 64
64 -
 65
65 -
 66
66 -
67
-
68
-
69
-
70
-
71
-
72
-
73
-
74
-
75
-
76
-
77
-
78
-
79
-
80
-
81
-
82
-
83
-
84
-
85
-
86
-
87
-
88
-
89
-
90
-
91
-
92
-
93
-
94
-
95
-
96
-
97
-
98
-
99
-
100
-
101
-
102
-
103
-
104
-
105
-
106
-
107
-
108
-
109
-
110
-
111
-
112
-
113
-
114
-
115
-
116
-
117
-
118
-
119
-
120
-
121
-
122
-
123
-
124
 |
 |

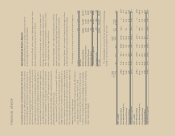
FINANCIAL REVIEW
As previously noted, reported SG&A reflects amounts recognized
for actions associated with Project Accelerate, the business trans-
formation program, spin-off related costs and other significant
amounts. These amounts include the following:
In millions 2011 2010 2009
Project Accelerate/Transformation costs $14 $«28 $«21
Spin-off related costs 44––
Curtailment gain – (14) (6)
Gain on property disposition – – (14)
Tax indemnification charge –26 –
Balance sheet corrections – – (11)
Total $58 $«40 $(10)
Additional information regarding the transformation/Project
Accelerate costs can be found in Note 6 to the Consolidated Financial
Statements, “Exit, Disposal and Transformation Activities.”
The corporation recognized curtailment gains in 2010 and 2009
related to its defined benefit pension plans. Additional information
regarding the pension charges and curtailment gains can be found
in Note 16 to the Consolidated Financial Statements, “Defined
Benefit Pension Plans.”
Exit Activities, Asset and Business Dispositions Exit activities,
asset and business dispositions are as follows:
In millions 2011 2010 2009
Charges for (income from) exit activities
Severance $÷95 $45 $98
Exit of leases and other
contractual obligations 9 14 (1)
Other 151
Asset and business dispositions –20 –
Total $105 $84 $98
The net charges in 2011 are $21 million higher than 2010
as a result of a $50 million increase in severance costs related
to restructuring actions partially offset by the decline in lease and
contractual obligation exit costs and a $20 million charge related
to an asset disposition in Spain in the prior year.
The net charges in 2010 are $14 million lower than 2009
as a result of a $53 million decline in severance costs related to
restructuring actions partially offset by a $20 million charge related
to an asset disposition in Spain.
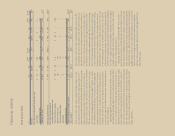
Total SG&A expenses reported in 2011 by the business
segments decreased by $27 million, or 1.4%, versus 2010 prima-
rily due to lower MAP spending and the benefits of cost saving
initiatives partially offset by the impact of inflation on wages and
employee benefits and the impact of the reclassification of certain
shipping and handling costs previously included in Cost of sales.
Amortization of intangibles increased by $1 million in 2011
versus 2010. General corporate expenses, which are not allocated
to the individual business segments, decreased by $91 million due
to a reduction in information technology costs, the impact of head-
count reductions, lower employee benefit costs, lower franchise
taxes and a gain on the sale of the corporate airplane. Unrealized
mark-to-market gains on commodity derivatives included in SG&A
increased by $6 million as compared to the prior year.
Total selling, general and administrative expenses in 2010
increased $111 million, or 5.4%. Changes in foreign currency
exchange rates, primarily in the European euro, increased SG&A
expenses by $31 million, or 1.6%. The remaining increase in SG&A
expenses was $80 million, or 3.8%. Measured as a percent of
sales, SG&A expenses increased from 24.8% in 2009 to 26.2%
in 2010. SG&A expenses as a percent of sales increased in each
of the business segments, with the exception of North American
Foodservice. The results reflect the impact of higher MAP expenses
and the impact of the 53rd week partially offset by the benefits of
cost saving initiatives.
Total SG&A expenses reported in 2010 by the business segments
increased by $80 million, or 4.4%, versus 2009 primarily due to
higher MAP spending, the impact of changes in foreign currency
exchange rates, the impact of inflation on wages and employee
benefits and the impact of the 53rd week partially offset by the
benefits of cost saving initiatives.
Amortization of intangibles in 2010 was unchanged versus
2009. General corporate expenses in 2010 increased by $33 million
due to a $26 million tax indemnification charge related to a previ-
ously divested business, higher Project Accelerate charges and the
year-over-year negative impact of approximately $22 million of gains
in 2009 – primarily a non-income related foreign tax refund and a
reduction in contingent lease accruals. These increases were partially
offset by a pension curtailment gain and lower benefit plan expenses.
Unrealized mark-to-market losses on commodity derivatives declined
$2 million on a year-over-year basis.