Sara Lee 2011 Annual Report Download - page 117
Download and view the complete annual report
Please find page 117 of the 2011 Sara Lee annual report below. You can navigate through the pages in the report by either clicking on the pages listed below, or by using the keyword search tool below to find specific information within the annual report.-
 1
1 -
2
-
3
-
4
-
5
-
6
-
7
-
8
-
9
-
10
-
11
-
12
-
13
-
14
-
15
-
16
-
17
-
18
-
19
-
20
-
21
-
22
-
23
-
24
-
25
-
26
-
27
-
28
-
29
-
30
-
31
-
32
-
33
-
34
-
35
-
36
-
37
-
38
-
39
-
40
-
41
-
42
-
43
-
44
-
45
-
46
-
47
-
48
-
49
-
50
-
51
-
52
-
53
-
54
-
55
-
56
-
57
-
58
-
59
-
60
-
61
-
62
-
63
-
64
-
65
-
66
-
67
-
68
-
69
-
70
-
71
-
72
-
73
-
74
-
75
-
76
-
77
-
78
-
79
-
80
-
81
-
82
-
83
-
84
-
85
-
86
-
87
-
88
-
89
-
90
-
91
-
92
-
93
-
94
-
95
-
96
-
97
-
98
-
99
-
100
-
101
-
102
-
103
-
104
-
105
-
106
-
 107
107 -
 108
108 -
 109
109 -
 110
110 -
 111
111 -
 112
112 -
 113
113 -
 114
114 -
 115
115 -
 116
116 -
 117
117 -
 118
118 -
 119
119 -
 120
120 -
 121
121 -
 122
122 -
 123
123 -
 124
124
 |
 |

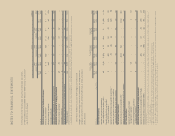
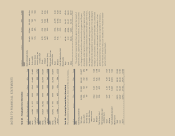
The amounts reported for operating segment income and
operating income may include, but are not limited to, amounts rec-
ognized in the Consolidated Statements of Income for exit activities,
asset and business dispositions, impairment charges, transformation/
Accelerate charges, and pension curtailment gains/losses. See the
Operating Results by Business Segment section of the Financial
Review for additional information regarding these amounts.
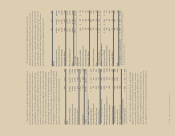
In millions 2011 2010 2009
Assets
North American Retail $1,432 $1,293 $1,266
North American Foodservice 645 687 754
International Beverage 2,334 1,871 1,932
International Bakery 682 607 719
5,093 4,458 4,671
Net assets held for sale 1,676 2,614 2,827
Other12,764 1,764 1,921
Total assets $9,533 $8,836 $9,419
Depreciation
North American Retail $99 $÷÷«97 $÷÷«95
North American Foodservice 40 50 41
International Beverage 95 88 91
International Bakery 22 24 25
256 259 252
Discontinued operations 35 88 109
Other 11 21 22
Total depreciation $÷«302 $÷«368 $÷«383
Additions to Long-Lived Assets
North American Retail $÷«232 $÷«163 $÷«110
North American Foodservice 28 32 47
International Beverage 157 85 100
International Bakery 17 20 20
434 300 277
Other 15 6 26
Total additions to long-lived assets $÷«449 $÷«306 $÷«303
1 Principally cash and cash equivalents, certain corporate fixed assets, deferred tax assets
and certain other noncurrent assets.
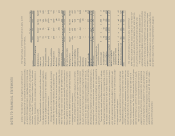
The corporation’s management uses operating segment income,
which is defined as operating income before general corporate
expenses and amortization of trademarks and customer relation-
ship intangibles, to evaluate segment performance and allocate
resources. Management believes it is appropriate to disclose this
measure to help investors analyze the business performance and
trends of the various business segments. Interest and other debt
expense, as well as income tax expense, are centrally managed,
and accordingly, such items are not presented by segment since
they are not included in the measure of segment profitability reviewed
by management. The accounting policies of the segments are the
same as those described in Note 2 to the Consolidated Financial
Statements, “Summary of Significant Accounting Policies.”
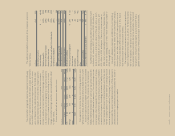
In millions 2011 2010 2009
Sales
North American Retail $2,868 $2,818 $2,767
North American Foodservice 1,566 1,547 1,776
International Beverage 3,548 3,221 3,062
International Bakery 726 785 795
8,708 8,371 8,400
Intersegment (27) (32) (34)
Total $8,681 $8,339 $8,366
Operating Segment Income (Loss)
North American Retail $÷«307 $÷«343 $÷«247
North American Foodservice 79 60 (20)
International Beverage 452 592 493
International Bakery (12) (14) (194)
Total operating segment income 826 981 526
General corporate expenses (188) (259) (225)
Mark-to-market derivative gain/(loss) 11 (13) (12)
Amortization of intangibles (22) (21) (21)
Contingent sale proceeds – 133 150
Total operating income 627 821 418
Net interest expense (85) (115) (120)
Debt extinguishment costs (55) – –
Income from continuing operations
before income taxes $÷«487 $÷«706 $÷«298
Net sales for a business segment may include sales between
segments. Such sales are at transfer prices that are equivalent
to market value. Revenues from Wal-Mart Stores Inc. represent
approximately $1.0 billion $1.0 billion and $900 million of the
corporation’s consolidated revenues for continuing operations in
2011, 2010 and 2009, respectively. Each of the corporation’s busi-
ness segments sells to this customer, except International Bakery.
114/115 Sara Lee Corporation and Subsidiaries