Sara Lee 2011 Annual Report Download - page 62
Download and view the complete annual report
Please find page 62 of the 2011 Sara Lee annual report below. You can navigate through the pages in the report by either clicking on the pages listed below, or by using the keyword search tool below to find specific information within the annual report.-
 1
1 -
2
-
3
-
4
-
5
-
6
-
7
-
8
-
9
-
10
-
11
-
12
-
13
-
14
-
15
-
16
-
17
-
18
-
19
-
20
-
21
-
22
-
23
-
24
-
25
-
26
-
27
-
28
-
29
-
30
-
31
-
32
-
33
-
34
-
35
-
36
-
37
-
38
-
39
-
40
-
41
-
42
-
43
-
44
-
45
-
46
-
47
-
48
-
49
-
50
-
51
-
 52
52 -
 53
53 -
 54
54 -
 55
55 -
 56
56 -
 57
57 -
 58
58 -
 59
59 -
 60
60 -
 61
61 -
 62
62 -
 63
63 -
 64
64 -
 65
65 -
 66
66 -
 67
67 -
 68
68 -
 69
69 -
 70
70 -
 71
71 -
 72
72 -
73
-
74
-
75
-
76
-
77
-
78
-
79
-
80
-
81
-
82
-
83
-
84
-
85
-
86
-
87
-
88
-
89
-
90
-
91
-
92
-
93
-
94
-
95
-
96
-
97
-
98
-
99
-
100
-
101
-
102
-
103
-
104
-
105
-
106
-
107
-
108
-
109
-
110
-
111
-
112
-
113
-
114
-
115
-
116
-
117
-
118
-
119
-
120
-
121
-
122
-
123
-
124
 |
 |

FINANCIAL REVIEW
2011 versus 2010
Net sales increased by $50 million, or 1.8%,
while adjusted net sales increased 3.3% after adjusting for the
impact of acquisitions and the additional 53rd week in the prior year.
Sales increased as a result of pricing actions and an improved
sales mix, which offset lower unit volumes. Unit volumes decreased
3.8% as a result of declines for frozen bakery products, hot dogs
and smoked sausage partially offset by higher volumes for break-
fast sandwiches and lunchmeats. Unit volumes were negatively
impacted by pricing actions and the rationalization of low-margin
promotional programs. Pricing actions, net of trade promotions,
increased net sales by 5.5%. The improved sales mix was driven
in part by the sale of innovative new products in the breakfast and
lunchmeat categories.
Operating segment income decreased by $36 million, or 10.6%,
while adjusted operating segment income decreased by $18 million,
or 5.2%. The decrease in operating segment income was due to a
significant increase in commodity costs net of pricing actions, higher
costs related to the implementation of new information systems,
start up costs associated with the new Kansas City meat plant and
lower unit volumes, partially offset by an improved sales mix, savings
from continuous improvement programs and lower MAP and other
SG&A expenses.
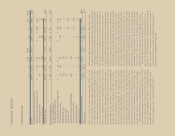
North American Retail
Dollar Percent Dollar Percent
In millions 2011 2010 Change Change 2010 2009 Change Change
Net sales $2,868 $2,818 $«50 1.8 % $2,818 $2,767 $51 1.8%
Less: Increase/(decrease) in net sales from
Acquisition $÷÷«11 $÷÷«÷– $«11 $÷÷÷«– $÷÷÷«– $÷–
Impact of 53rd week – 52 (52) 52 – 52
Adjusted net sales $2,857 $2,766 $«91 3.3 % $2,766 $2,767 $«(1) 0.0%
Operating segment income $÷«307 $÷«343 $(36) (10.6) % $÷«343 $÷«247 $96 38.7%
Less: Increase/(decrease) in
operating segment income from
Project Accelerate charges $÷÷÷(2) $÷÷÷(4) $÷«2 $÷÷÷(4) $÷÷÷«– $«(4)
Spin-off related costs (9) – (9) – – –
Pension curtailment gain –7(7) 7–7
Acquisition 1–1 –––
Impact of 53rd week –5(5) 5–5
Adjusted operating segment income $÷«317 $÷«335 $(18) (5.2) % $÷«335 $÷«247 $88 35.4%
Gross margin % 30.6 % 33.4 % (2.8) % 33.4 % 28.8% 4.6%
2010 versus 2009
Net sales increased by $51 million, or 1.8%.
The increase was due to the impact of the 53rd week in 2010 as
adjusted net sales were virtually unchanged. Sales increased as
a result of an improved sales mix driven in part by higher sales in
the breakfast sandwich, breakfast sausage, branded lunchmeat
and smoked sausage categories partially offset by the continuing
exit of the lower margin commodity hog business and the impact
of the exit of the kosher meat business in the third quarter of 2009.
Pricing actions, net of trade promotions, decreased net sales by
approximately 2%. The overall unit volume decline of 5.5% was due
to the continuing exit of the commodity hog business and the exit
of the kosher meat business. Unit volumes, excluding the planned
exit from the commodity meat and kosher meat businesses, increased
2.7% due to higher volumes for breakfast sandwiches and sausages,
smoked sausages and sliced meats, which more than offset volume
declines for frozen bakery products.
Operating segment income increased by $96 million, or 38.7%
due in part to a pension curtailment gain and the impact of the 53rd
week, net of the negative impact of the change in exit activities and
asset and business dispositions, which increased operating segment
income by $8 million. Adjusted operating segment income increased
by $88 million, or 35.4%, due to lower commodity costs, an improved
sales mix, and savings from continuous improvement programs,
partially offset by increased trade promotions and higher MAP and
other SG&A costs.