Sara Lee 2009 Annual Report Download - page 85
Download and view the complete annual report
Please find page 85 of the 2009 Sara Lee annual report below. You can navigate through the pages in the report by either clicking on the pages listed below, or by using the keyword search tool below to find specific information within the annual report.-
 1
1 -
2
-
3
-
4
-
5
-
6
-
7
-
8
-
9
-
10
-
11
-
12
-
13
-
14
-
15
-
16
-
17
-
18
-
19
-
20
-
21
-
22
-
23
-
24
-
25
-
26
-
27
-
28
-
29
-
30
-
31
-
32
-
33
-
34
-
35
-
36
-
37
-
38
-
39
-
40
-
41
-
42
-
43
-
44
-
45
-
46
-
47
-
48
-
49
-
50
-
51
-
52
-
53
-
54
-
55
-
56
-
57
-
58
-
59
-
60
-
61
-
62
-
63
-
64
-
65
-
66
-
67
-
68
-
69
-
70
-
71
-
72
-
73
-
74
-
 75
75 -
 76
76 -
 77
77 -
 78
78 -
 79
79 -
 80
80 -
 81
81 -
 82
82 -
 83
83 -
 84
84 -
 85
85 -
 86
86 -
 87
87 -
 88
88 -
 89
89 -
 90
90 -
 91
91 -
 92
92
 |
 |

Sara Lee Corporation and Subsidiaries 83
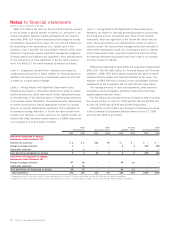
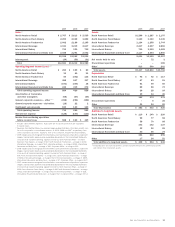
2009 2008 2007
Sales1,2
North American Retail $÷2,767 $÷2,613 $÷2,535
North American Fresh Bakery 2,200 2,028 1,856
North American Foodservice 2,092 2,186 2,165
International Beverage 3,041 3,215 2,617
International Bakery 790 929 799
International Household and Body Care 2,025 2,291 2,042
12,915 13,262 12,014
Intersegment (34) (50) (31)
Total $12,881 $13,212 $11,983
Operating Segment Income (Loss)3,4,5
North American Retail $÷÷«260 $÷÷«155 $÷÷÷«80
North American Fresh Bakery 33 60 14
North American Foodservice 54 (302) 135
International Beverage 488 547 317
International Bakery (193) (346) 38
International Household and Body Care 242 315 272
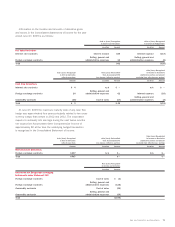
Total operating segment income 884 429 856
Amortization of trademarks
and other intangibles (65) (67) (64)
General corporate expenses – other3,4,5 (238) (254) (352)
General corporate expenses – derivatives (18) 22 2
Contingent sale proceeds 150 130 120
Total operating income 713 260 562
Net interest expense (125) (100) (133)
Income from continuing operations
before income taxes $÷÷«588 $÷÷«160 $÷÷«429
1Includes sales between segments. Such sales are at transfer prices that are equivalent
to market value.
2Revenues from Wal-Mart Stores, Inc. represent approximately $1.5 billion, $1.3 billion and $1.3 bil-
lion of the corporation’s consolidated revenues in 2009, 2008 and 2007, respectively. Each
of the corporation’s business segments sells to this customer, except International Bakery.
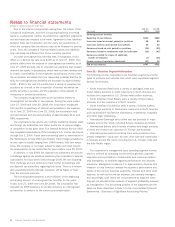
32009 includes amounts recognized for exit activities, asset and business dispositions, impairment
charges, transformation expenses and accelerated depreciation in the Consolidated Statements
of Income that impacted operating segment income by: North American Retail – nil; North
American Fresh Bakery – a charge of $37; North American Foodservice – a charge of $106;
International Beverage – a charge of $32; International Bakery – a charge of $245; International
Household and Body Care – a charge of $10; Corporate Office – a charge of $31.
42008 includes amounts recognized for exit activities, asset and business dispositions, impairment
charges, transformation expenses and accelerated depreciation in the Consolidated Statements
of Income that impacted operating segment income by: North American Retail – a charge of
$34; North American Fresh Bakery – a charge of $3; North American Foodservice – a charge
of $436; International Beverage – a charge of $15; International Bakery – a charge of $409;
International Household and Body Care – a charge of $7; Corporate Office – a charge of $37.
52007 includes amounts recognized for exit activities, asset and business dispositions, impairment
charges, transformation expenses and accelerated depreciation in the Consolidated Statements
of Income that impacted operating segment income by: North American Retail – a charge of
$118; North American Fresh Bakery – a charge of $42; North American Foodservice – a charge
of $11; International Beverage – a charge of $139; International Bakery – a charge of $18;
International Household and Body Care – a charge of $17; Corporate Office – a charge of $72.
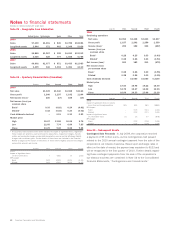
2009 2008 2007
Assets
North American Retail $1,266 $÷1,287 $÷1,197
North American Fresh Bakery 1,140 1,160 1,135
North American Foodservice 1,134 1,258 1,744
International Beverage 2,217 2,637 2,886
International Bakery 730 1,153 1,485
International Household and Body Care 2,117 2,664 2,880
8,604 10,159 11,327
Net assets held for sale –72 2
Discontinued operations – – 185
Other1813 599 241
Total assets $9,417 $10,830 $11,755
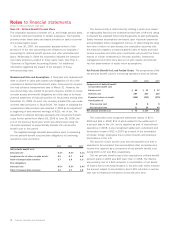
Depreciation
North American Retail $÷÷«95 $÷÷÷«92 $÷÷«117
North American Fresh Bakery 67 63 61
North American Foodservice 51 69 66
International Beverage 88 88 72
International Bakery 26 28 24
International Household and Body Care 35 34 35
362 374 375
Discontinued operations –525
Other 21 24 20
Total depreciation $÷«383 $÷÷«403 $÷÷«420
Additions to Long-Lived Assets
North American Retail $÷«110 $÷÷149 $÷÷«220
North American Fresh Bakery 58 77 58
North American Foodservice 58 70 88
International Beverage 103 142 127
International Bakery 22 26 28
International Household and Body Care 40 46 74
391 510 595
Other 17 24 51
Total additions to long-lived assets $÷«408 $÷÷«534 $÷÷«646
1Principally cash and cash equivalents, certain corporate fixed assets, deferred tax assets
and certain other noncurrent assets.