Sara Lee 2009 Annual Report Download - page 32
Download and view the complete annual report
Please find page 32 of the 2009 Sara Lee annual report below. You can navigate through the pages in the report by either clicking on the pages listed below, or by using the keyword search tool below to find specific information within the annual report.-
 1
1 -
2
-
3
-
4
-
5
-
6
-
7
-
8
-
9
-
10
-
11
-
12
-
13
-
14
-
15
-
16
-
17
-
18
-
19
-
20
-
21
-
 22
22 -
 23
23 -
 24
24 -
 25
25 -
 26
26 -
 27
27 -
 28
28 -
 29
29 -
 30
30 -
 31
31 -
 32
32 -
 33
33 -
 34
34 -
 35
35 -
 36
36 -
 37
37 -
 38
38 -
 39
39 -
 40
40 -
 41
41 -
 42
42 -
43
-
44
-
45
-
46
-
47
-
48
-
49
-
50
-
51
-
52
-
53
-
54
-
55
-
56
-
57
-
58
-
59
-
60
-
61
-
62
-
63
-
64
-
65
-
66
-
67
-
68
-
69
-
70
-
71
-
72
-
73
-
74
-
75
-
76
-
77
-
78
-
79
-
80
-
81
-
82
-
83
-
84
-
85
-
86
-
87
-
88
-
89
-
90
-
91
-
92
 |
 |

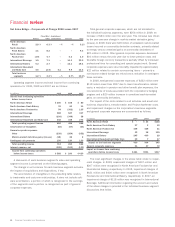
Financial review
30 Sara Lee Corporation and Subsidiaries
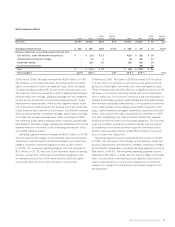
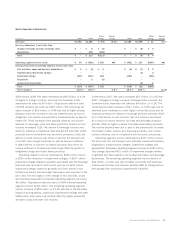
2009 versus 2008
Net sales decreased by $174 million, or 5.4%.
The impact of foreign currency changes, particularly in the European
euro, Brazilian real, Australian dollar, and British pound, decreased
reported net sales by $284 million, or 9.1%. Acquisitions net of
dispositions after the start of 2008 increased sales by $37 million,
or 1.2%. The remaining increase in net sales of $73 million, or 2.5%
resulted from price increases to offset higher commodity costs, a
favorable sales mix shift, and increased green coffee export sales
in Brazil, which were partially offset by lower unit volumes. Pricing
actions represented approximately 2% of the overall increase in
net sales. Unit volumes decreased 2.8% due to declines in the
retail channel in both Europe and Brazil. Retail volumes in Europe
decreased due to volume declines in traditional roast and ground
due in part to competitive pressures from private label and hard
discounters as well as the weak economic conditions throughout
Europe, partially offset by growth in single serve coffee in France
and Germany. Unit volumes declined in Brazil due in part to price
increases. Unit volumes in the foodservice channel decreased
slightly due in part to a decline in liquid coffee concentrates.
Operating segment income decreased by $59 million, or 10.8%.
Changes in foreign currency exchange rates decreased operating
segment income by $40 million, or 7.2%. The net impact of the
change in exit activities, asset and business dispositions, transfor-
mation/Accelerate charges, and accelerated depreciation decreased
operating segment income by $43 million. Operating results were
favorably impacted by a $12 million curtailment gain related to
postretirement benefit plan changes and a $14 million gain on the
disposition of property. Acquisitions made after the start of 2008,
increased operating segment income by $2 million. The remaining
operating segment income decrease of $4 million, or 0.7% was
due to the impact of higher green coffee costs, the decline in unit
volumes and higher manufacturing costs, partially offset by pricing
actions, a favorable shift in sales mix, and the benefits of continuous
improvement programs.
2008 versus 2007
Net sales increased by $598 million, or 22.9%.
The impact of changes in foreign currency exchange rates, particularly
in the European euro and Brazilian real, increased reported net sales
by $347 million, or 14.3%, while a disposition decreased sales
by $2 million. The remaining net sales increase of $253 million,
or 8.6%, was due to the impact of pricing actions, a favorable sales
mix into higher priced single serve products and concentrates, and
an increase in unit volumes. Net unit volumes increased 1.5% with
increases in both the retail and foodservice sectors. In the retail
channel, volume growth was driven by increases in single-serve
products, especially in France and the Netherlands, and in instant
coffees. Unit volume growth in the foodservice channel was driven
by increased sales of liquid coffee concentrates.
Operating segment income increased by $230 million, or 72.8%.
Changes in foreign currency exchange rates increased operating
segment income by $59 million, or 14.2%. The net impact of the
change in exit activities, asset and business dispositions, transfor-
mation charges, depreciation and impairment charges increased
operating segment income by $124 million, or 49.4%. The remaining
operating segment income increase of $47 million, or 9.2%, was
due to the favorable impact of price increases, higher unit volumes
and the benefits of continuous improvement programs, which were
partially offset by higher green coffee and packaging costs and
an increase in SG&A costs due to higher labor costs to support
general growth in the business.
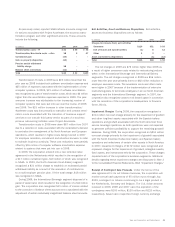
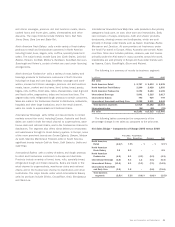
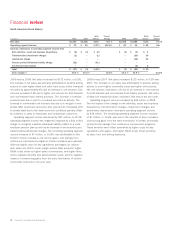
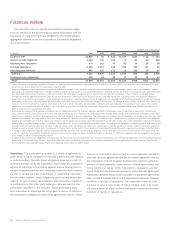
International Beverage
Dollar Percent Dollar Percent
In millions 2009 2008 Change Change 2008 2007 Change Change
Net sales $3,041 $3,215 $(174) (5.4) % $3,215 $2,617 $598 22.9 %
Increase/(decrease) in net sales from
Changes in foreign currency exchange rates $«««««««– $«««284 $(284) $÷÷÷«– $÷(347) $347
Acquisitions/dispositions 45 8 37 – 2 (2)
Total $«««««45 $«««292 $(247) $÷÷÷«– $÷(345) $345
Operating segment income $«««488 $«««547 $««(59) (10.8) % $÷«547 $÷«317 $230 72.8 %
Increase/(decrease) in operating segment income from
Changes in foreign currency exchange rates $«««««««– $«««««40 $««(40) $÷÷÷«– $÷÷(59) $÷59
Exit activities, asset and business dispositions (50) (4) (46) (4) (12) 8
Transformation/Accelerate charges (8) (10) 2 (10) (8) (2)
Curtailment gain 12–12 –––
Impairment charge – – – – (118) 118
Accelerated depreciation – (1) 1 (1) (1) –
Gain on property disposition 14–14 –––
Acquisitions/dispositions 2–2 –––
Total $««««(30) $«««««25 $««(55) $÷÷(15) $÷(198) $183
Gross margin % 40.0 % 41.4 % (1.4) % 41.4 % 43.0 % (1.6) %