Sara Lee 2009 Annual Report Download - page 30
Download and view the complete annual report
Please find page 30 of the 2009 Sara Lee annual report below. You can navigate through the pages in the report by either clicking on the pages listed below, or by using the keyword search tool below to find specific information within the annual report.-
 1
1 -
2
-
3
-
4
-
5
-
6
-
7
-
8
-
9
-
10
-
11
-
12
-
13
-
14
-
15
-
16
-
17
-
18
-
19
-
 20
20 -
 21
21 -
 22
22 -
 23
23 -
 24
24 -
 25
25 -
 26
26 -
 27
27 -
 28
28 -
 29
29 -
 30
30 -
 31
31 -
 32
32 -
 33
33 -
 34
34 -
 35
35 -
 36
36 -
 37
37 -
 38
38 -
 39
39 -
 40
40 -
41
-
42
-
43
-
44
-
45
-
46
-
47
-
48
-
49
-
50
-
51
-
52
-
53
-
54
-
55
-
56
-
57
-
58
-
59
-
60
-
61
-
62
-
63
-
64
-
65
-
66
-
67
-
68
-
69
-
70
-
71
-
72
-
73
-
74
-
75
-
76
-
77
-
78
-
79
-
80
-
81
-
82
-
83
-
84
-
85
-
86
-
87
-
88
-
89
-
90
-
91
-
92
 |
 |

Financial review
28 Sara Lee Corporation and Subsidiaries
2009 versus 2008
Net sales increased by $172 million, or 8.5%.
The increase in net sales was primarily attributable to positive pricing
actions to cover higher wheat and other input costs, which increased
net sales by approximately 6%, and an increase in unit volumes. Unit
volumes increased 3.2% due to higher unit volumes for both branded
and non-branded fresh bakery products. The increase in branded
products was due in part to increased promotional activity. The
increase in non-branded unit volumes was due to a net gain in new
private label customers versus the prior year and an increasing shift
to private label due to the weak economic conditions partially offset
by a decline in sales to restaurant and institutional customers.
Operating segment income decreased by $27 million, or 45.5%.
Operating segment income was negatively impacted by a $31 million
charge to recognize a partial withdrawal liability related to a multi-
employer pension plan as well as an increase in exit activities and
transformation/Accelerate charges. The remaining operating segment
income increase of $7 million, or 10.8%, was attributable to the
benefit of price increases, unit volume gains, and savings from
continuous improvement programs. These increases were partially
offset by higher costs for key ingredients and wages; an unfavor-
able sales mix shift to lower margin private label products; higher
SG&A costs driven by higher sales commissions, and higher labor,
other employee benefits and administrative costs; and the negative
impact of nonrecurring gains from the early termination of certain
commodity contracts in the prior year.
2008 versus 2007
Net sales increased $172 million, or 9.3% over
2007. The increase in net sales was attributable to positive pricing
actions to cover higher commodity costs and higher unit volumes.
Net unit volumes increased 1.1% due to an increase in unit volumes
for both branded and non-branded fresh bakery products. Net sales
of Sara Lee branded products increased 19% versus the prior year.
Operating segment income increased by $46 million in 2008.
The net impact of the change in exit activities, asset and business
dispositions, transformation charges, impairment charges and
accelerated depreciation increased operating segment income
by $39 million. The remaining operating segment income increase
of $7 million, or 13.6%, was due to the benefits of price increases,
nonrecurring gains from the early termination of certain commodity
contracts and savings from continuous improvement programs.
These benefits were offset somewhat by higher costs for key
ingredients and wages, and higher SG&A costs driven primarily
by labor, fuel, and selling expenses.
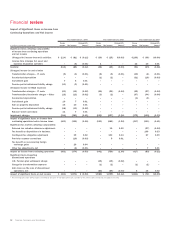
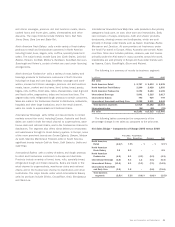
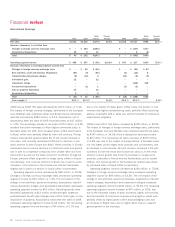
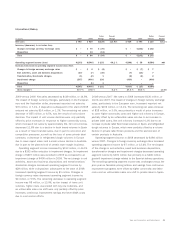
North American Fresh Bakery
Dollar Percent Dollar Percent
In millions 2009 2008 Change Change 2008 2007 Change Change
Net sales $2,200 $2,028 $172 8.5 % $2,028 $1,856 $172 9.3 %%
Operating segment income $÷«««33 $«««««60 $«(27) (45.5) % $«««««60 $«««««14 $««46 NM
Increase/(decrease) in operating segment income from
Exit activities, asset and business dispositions $÷««««(5) $÷««««(3) $«««(2) $««««««(3) $««««««(4) $««««1
Transformation/Accelerate charges (1) – (1) – (20) 20
Impairment charge – – – – (16) 16
Pension partial withdrawal liability charge (31) – (31) – – –
Accelerated depreciation ––– –(2)2
Total $««««(37) $««««««(3) $«(34) $««««««(3) $««««(42) $««39
Gross margin % 45.3 % 47.2 % (1.9) % 47.2 % 47.5 % (0.3) %%