Sara Lee 2009 Annual Report Download - page 29
Download and view the complete annual report
Please find page 29 of the 2009 Sara Lee annual report below. You can navigate through the pages in the report by either clicking on the pages listed below, or by using the keyword search tool below to find specific information within the annual report.-
 1
1 -
2
-
3
-
4
-
5
-
6
-
7
-
8
-
9
-
10
-
11
-
12
-
13
-
14
-
15
-
16
-
17
-
18
-
 19
19 -
 20
20 -
 21
21 -
 22
22 -
 23
23 -
 24
24 -
 25
25 -
 26
26 -
 27
27 -
 28
28 -
 29
29 -
 30
30 -
 31
31 -
 32
32 -
 33
33 -
 34
34 -
 35
35 -
 36
36 -
 37
37 -
 38
38 -
 39
39 -
40
-
41
-
42
-
43
-
44
-
45
-
46
-
47
-
48
-
49
-
50
-
51
-
52
-
53
-
54
-
55
-
56
-
57
-
58
-
59
-
60
-
61
-
62
-
63
-
64
-
65
-
66
-
67
-
68
-
69
-
70
-
71
-
72
-
73
-
74
-
75
-
76
-
77
-
78
-
79
-
80
-
81
-
82
-
83
-
84
-
85
-
86
-
87
-
88
-
89
-
90
-
91
-
92
 |
 |

Sara Lee Corporation and Subsidiaries 27
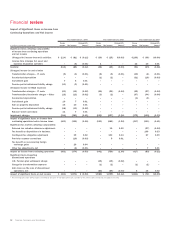
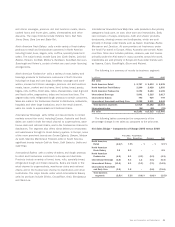
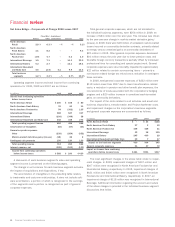
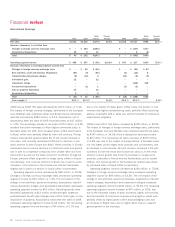
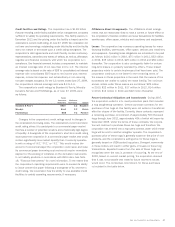
North American Retail
Dollar Percent Dollar Percent
In millions 2009 2008 Change Change 2008 2007 Change Change
Net sales $2,767 $2,613 $154 5.9% $2,613 $2,535 $«««78 3.1%
Operating segment income $÷«260 $«««155 $105 67.9% $«««155 $«««««80 $«««75 94.4%
Increase/(decrease) in operating segment income from
Exit activities, asset and business dispositions $÷«÷««– $««««(13) $««13 $(13) $««««(38) $«««25
Transformation/Accelerate charges – (1) 1 (1) (18) 17
Impairment charge – (20) 20 (20) (34) 14
Accelerated depreciation – – – – (28) 28
Total $÷«÷««– $««««(34) $««34 $««««(34) $««(118) $«««84
Gross margin % 28.9% 28.5 % 0.4% 28.5 % 27.8 % 0.7%
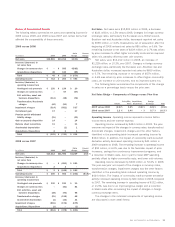
2009 versus 2008
Net sales increased by $154 million, or 5.9%.
The increase in net sales was driven by pricing actions to offset
higher commodity and other raw material costs, which increased
net sales by approximately 6%, as well as an improved sales mix.
The improved sales mix related to a shift to higher-priced branded
products within the hot dogs, breakfast sausage and deli categories
as well as the introduction of new value-added products. These
improvements were partially offset by the negative impact of the
exit of the kosher meat business, the phasing out of the commodity
meats business and a decline in unit volumes. Unit volumes declined
2.0%, as volume growth in breakfast sausage, sliced meats, hot dogs,
corn dogs, and smoked sausage were offset by declines in retail
deli meat and frozen bakery products driven in part by planned SKU
rationalization and other margin improvement initiatives. Unit volume
declines were also the result of the continuing planned exit of the
commodity meats business.
Operating segment income increased by $105 million, or 67.9%.
The net impact of the change in exit activities, asset and business
dispositions, transformation/Accelerate charges and impairment
charges increased operating segment income by $34 million,
or 30.2%. The remaining operating segment income increase of
$71 million, or 37.7%, was due to the favorable impact of pricing
actions; savings from continuous improvement programs; and
an improved product mix; which were partially offset by higher
commodity, labor and fuel costs and lower unit volumes.
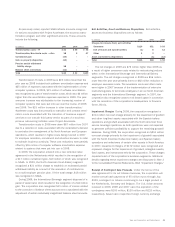
2008 versus 2007
Net sales in 2008 increased by $78 million,
or 3.1%, due to an increase in unit volumes and positive pricing
actions to offset higher commodity and other raw material costs.
These increases were partially offset by a significant decline in the
net sales of non-retail commodity meats, due to an unfavorable
shift in sales mix. Unit volumes increased 2.8% with increases in
branded frozen bakery products, retail branded and deli meat products,
and non-retail commodity meat products. The increased unit volumes
in the retail branded meats category were driven by growth in hot
dogs, cooked breakfast sausages, sandwiches and sliced luncheon
meats. Unit volumes were also impacted by the shutdown in 2007
of a pork slaughtering and meat production facility that supplied
products to both the retail and commodity categories. For non-retail
meat commodities, exiting the production facility had the impact
of increasing unit volumes as whole hogs are now being sold to
another meat processor but an unfavorable impact on net sales
due to a lower unit sales price.
Operating segment income increased by $75 million, or 94.4%,
in 2008. The net impact of the change in exit activities, asset and
business dispositions, transformation charges, impairment charges
and accelerated depreciation increased operating segment income by
$84 million, or 99.2%. The remaining operating segment income
decrease of $9 million, or 4.8%, was the result of higher commodity,
labor, fuel and other manufacturing costs partially offset by the
volume improvements in core product categories, an improved
product mix, savings from continuous improvement programs and
pricing actions.