Sara Lee 2009 Annual Report Download - page 49
Download and view the complete annual report
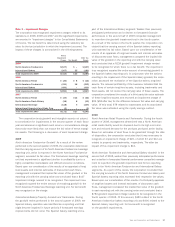
Please find page 49 of the 2009 Sara Lee annual report below. You can navigate through the pages in the report by either clicking on the pages listed below, or by using the keyword search tool below to find specific information within the annual report.
Sara Lee Corporation and Subsidiaries 47
Consolidated statements of income
Dollars in millions except per share data Years ended June 27, 2009 June 28, 2008 June 30, 2007
Continuing Operations
Net sales $12,881 $13,212 $11,983
Cost of sales 8,098 8,154 7,370
Selling, general and administrative expenses 3,792 4,039 3,905
Net charges for exit activities, asset and business dispositions 114 38 94
Impairment charges 314 851 172
Contingent sale proceeds (150) (130) (120)
Interest expense 170 187 261
Interest income (45) (87) (128)
12,293 13,052 11,554
Income from continuing operations before income taxes 588 160 429
Income tax expense (benefit) 224 201 (11)
Income (loss) from continuing operations 364 (41) 440
Discontinued Operations
Net income (loss) from discontinued operations, net of tax expense of nil, nil, and $34 – (14) 48
Gain (loss) on sale of discontinued operations, net of tax expense (benefit) of nil, $1, and $(11) – (24) 16
Net income (loss) $÷÷«364 $««««««(79) $«««««504
Income (loss) from continuing operations per share of common stock
Basic $÷÷0.52 $«««(0.06) $««««0.59
Diluted $÷÷0.52 $«««(0.06) $««««0.59
Net income (loss) per share of common stock
Basic $÷÷0.52 $«««(0.11) $««««0.68
Diluted $÷÷0.52 $«««(0.11) $««««0.68
The accompanying Notes to Financial Statements are an integral part of these statements.


