Sara Lee 2009 Annual Report Download - page 31
Download and view the complete annual report
Please find page 31 of the 2009 Sara Lee annual report below. You can navigate through the pages in the report by either clicking on the pages listed below, or by using the keyword search tool below to find specific information within the annual report.-
 1
1 -
2
-
3
-
4
-
5
-
6
-
7
-
8
-
9
-
10
-
11
-
12
-
13
-
14
-
15
-
16
-
17
-
18
-
19
-
20
-
 21
21 -
 22
22 -
 23
23 -
 24
24 -
 25
25 -
 26
26 -
 27
27 -
 28
28 -
 29
29 -
 30
30 -
 31
31 -
 32
32 -
 33
33 -
 34
34 -
 35
35 -
 36
36 -
 37
37 -
 38
38 -
 39
39 -
 40
40 -
 41
41 -
42
-
43
-
44
-
45
-
46
-
47
-
48
-
49
-
50
-
51
-
52
-
53
-
54
-
55
-
56
-
57
-
58
-
59
-
60
-
61
-
62
-
63
-
64
-
65
-
66
-
67
-
68
-
69
-
70
-
71
-
72
-
73
-
74
-
75
-
76
-
77
-
78
-
79
-
80
-
81
-
82
-
83
-
84
-
85
-
86
-
87
-
88
-
89
-
90
-
91
-
92
 |
 |

Sara Lee Corporation and Subsidiaries 29
2009 versus 2008
Net sales decreased by $94 million, or 4.3%.
Changes in foreign currency, primarily the Canadian dollar,
decreased net sales by $5 million. Dispositions after the start
of 2008 reduced net sales by $108 million. The remaining net
sales increase of $19 million, or 0.9% was due to higher product
pricing to cover the increase in key raw material costs across all
categories. The positive pricing actions increased sales by approxi-
mately 5%. These increases were partially offset by unit volume
declines for beverage, meat and bakery products. Overall net unit
volumes decreased 4.2%. The decline in beverage volumes was
driven by softness in traditional roast and ground and other coffee
products due to competitive and economic pressures, while the
decline in meat volumes was driven in part by the planned exit
of certain lower margin business as well as demand softness.
A slight decline in volumes for bakery products was driven by
volume softness in foodservice pizza dough offset by growth in
refrigerated dough and frozen bakery products.
Operating segment income increased by $356 million due to
a $324 million reduction in impairment charges. A $107 million
impairment charge related to goodwill associated with the beverage
business was recorded in the current year and a $431 million
impairment charge related to goodwill and fixed assets in the
foodservice bakery and beverage businesses was recorded in the
prior year. The net impact of the change in exit activities, asset
and business dispositions increased operating segment income by
$6 million. Dispositions after the start of 2008 reduced operating
segment income by $2 million. The remaining operating segment
income increase of $28 million, or 21.2% was due to the favorable
impact of pricing actions, continuous improvement savings and lower
SG&A costs, which were only partially offset by higher commodity
and labor costs and lower unit volumes.
2008 versus 2007
Net sales increased $21 million, or 1.0% over
2007. Changes in foreign currency exchange rates, primarily the
Canadian dollar, increased net sales by $4 million, or 0.2%. The
remaining net sales increase of $17 million, or 0.8%, was due to
selected price increases to cover higher commodity costs and an
improved product mix related to beverage products partially offset
by a 3.9% decline in unit volumes. Net unit volumes decreased
as a result of volume declines for meat and beverage products
partially offset by higher volumes for private label bakery products.
The volume declines were due in part to the planned exit of certain
low-margin meats, sauces and dressing products, and overall
volume softness due to competitive and economic pressures.
Operating segment income decreased by $437 million versus
the prior year. The net change in exit activities, asset and business
dispositions, transformation charges, impairment charges and
depreciation decreased operating segment income by $425 million.
This change included $431 million of impairment charges related
to goodwill and fixed assets in the foodservice bakery and beverage
businesses. The remaining operating segment income decline of
$12 million, or 9.2%, was due to higher commodity and overhead
costs as well as lower unit volumes, partially offset by pricing actions,
and savings from continuous improvement initiatives.
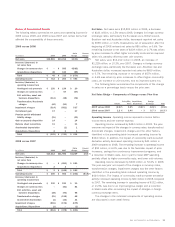
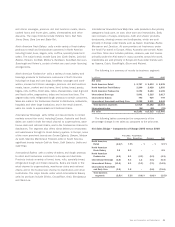
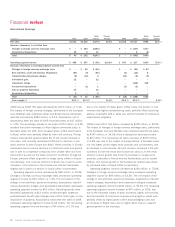
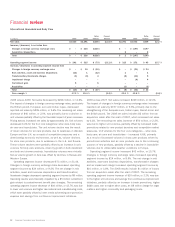
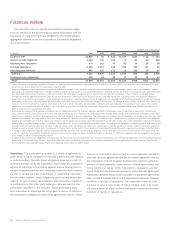
North American Foodservice
Dollar Percent Dollar Percent
In millions 2009 2008 Change Change 2008 2007 Change Change
Net sales $2,092 $2,186 $««(94) (4.3) % $2,186 $2,165 $«««21 1.0 %
Increase/(decrease) in net sales from
Changes in foreign currency exchange rates $«««««««– $«««««««5 $««««(5) $«««««««– $««««««(4) $«««««4
Dispositions – 108 (108) – – –
Total $«««««««– $«««113 $(113) $«««««««– $««««««(4) $«««««4
Operating segment income (loss) $«««««54 $««(302) $«356 NM $««(302) $«««135 $(437) NM
Increase/(decrease) in operating segment income (loss) from
Exit activities, asset and business dispositions $«««««««1 $««««««(5) $«««««6 $««««««(5) $««««««(7) $«««««2
Transformation/Accelerate charges ––– –(3)3
Impairment charge (107) (431) 324 (431) – (431)
Disposition –2(2) –––
Accelerated depreciation ––– –(1)1
Total $««(106) $««(434) $«328 $÷(436) $÷÷(11) $(425)
Gross margin % 25.5 % 25.0 % 0.5 % 25.0 % 26.4 % (1.4) %%