Sara Lee 2009 Annual Report Download - page 52
Download and view the complete annual report
Please find page 52 of the 2009 Sara Lee annual report below. You can navigate through the pages in the report by either clicking on the pages listed below, or by using the keyword search tool below to find specific information within the annual report.-
 1
1 -
2
-
3
-
4
-
5
-
6
-
7
-
8
-
9
-
10
-
11
-
12
-
13
-
14
-
15
-
16
-
17
-
18
-
19
-
20
-
21
-
22
-
23
-
24
-
25
-
26
-
27
-
28
-
29
-
30
-
31
-
32
-
33
-
34
-
35
-
36
-
37
-
38
-
39
-
40
-
41
-
 42
42 -
 43
43 -
 44
44 -
 45
45 -
 46
46 -
 47
47 -
 48
48 -
 49
49 -
 50
50 -
 51
51 -
 52
52 -
 53
53 -
 54
54 -
 55
55 -
 56
56 -
 57
57 -
 58
58 -
 59
59 -
 60
60 -
 61
61 -
 62
62 -
63
-
64
-
65
-
66
-
67
-
68
-
69
-
70
-
71
-
72
-
73
-
74
-
75
-
76
-
77
-
78
-
79
-
80
-
81
-
82
-
83
-
84
-
85
-
86
-
87
-
88
-
89
-
90
-
91
-
92
 |
 |

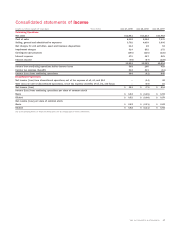
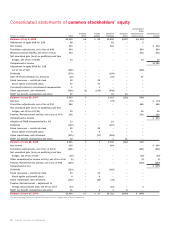
Consolidated statements of common stockholders’ equity
50 Sara Lee Corporation and Subsidiaries
Accumulated
Other
Common Capital Retained Unearned Comprehensive Comprehensive
Dollars in millions Total Stock Surplus Earnings Stock Income (Loss) Income
Balances at July 1, 2006 $2,449 $«8 $÷«62 $3,855 $(137) $(1,339)
Adjustment to apply SAB No. 108 58––53– 5
Net income 504 – – 504 – – $«««504
Translation adjustments, net of tax of $48 504––––504504
Minimum pension liability, net of tax of $(1) 143––––143143
Net unrealized gain (loss) on qualifying cash flow
hedges, net of tax of $(20) 34–––– 34 34
Comprehensive income $1,185
Adjustment to apply SFAS No. 158,
net of tax of $49 (168) ––––(168)
Dividends (370) – – (370) – –
Spin off of Hanesbrands Inc. business (29) – – (96) – 67
Stock issuances – restricted stock 29–29–– –
Stock option and benefit plans 47–47–– –
Tax benefit related to stock-based compensation 1–1–– –
Share repurchases and retirement (686) (1) (139) (546) – –
ESOP tax benefit, redemptions and other 27 – – 13 14 –
Balances at June 30, 2007 2,543 7 – 3,413 (123) (754)
Net loss (79) – – (79) – – $««««(79)
Translation adjustments, net of tax of $14 686––––686686
Net unrealized gain (loss) on qualifying cash flow
hedges, net of tax of $(14) 25–––– 25 25
Pension/Postretirement activity, net of tax of $(4) 192––––192192
Comprehensive income $«««824
Adoption of FASB Interpretation No. 48 13––13– –
Dividends (300) – – (300) – –
Stock issuances – restricted stock 25–25–– –
Stock option and benefit plans 9–9–– –
Share repurchases and retirement (315) – (27) (288) – –
ESOP tax benefit, redemptions and other 12––111 –
Balances at June 28, 2008 2,811 7 7 2,760 (112) 149
Net income 364 – – 364 – – $÷«364
Translation adjustments, net of tax of $(31) (561) ––––(561) (561)
Net unrealized gain (loss) on qualifying cash flow
hedges, net of tax of $16 (30)–––– (30) (30)
Other comprehensive income activity, net of tax of nil (2)–––– (2) (2)
Pension/Postretirement activity, net of tax of $93 (164) ––––(164) (164)
Comprehensive loss $÷(393)
Dividends (310) – – (310) – –
Stock issuances – restricted stock 29–29–– –
Stock option and benefit plans 4–4–– –
Share repurchases and retirement (103) – (25) (78) – –
Pension/Postretirement – adjustment to
change measurement date, net of tax of $7 (13) – – (16) – 3
ESOP tax benefit, redemptions and other 11–218 –
Balances at June 27, 2009 $2,036 $«7 $÷«17 $2,721 $(104) $÷«(605)
The accompanying Notes to Financial Statements are an integral part of these statements.