Sara Lee 2009 Annual Report Download - page 53
Download and view the complete annual report
Please find page 53 of the 2009 Sara Lee annual report below. You can navigate through the pages in the report by either clicking on the pages listed below, or by using the keyword search tool below to find specific information within the annual report.-
 1
1 -
2
-
3
-
4
-
5
-
6
-
7
-
8
-
9
-
10
-
11
-
12
-
13
-
14
-
15
-
16
-
17
-
18
-
19
-
20
-
21
-
22
-
23
-
24
-
25
-
26
-
27
-
28
-
29
-
30
-
31
-
32
-
33
-
34
-
35
-
36
-
37
-
38
-
39
-
40
-
41
-
42
-
 43
43 -
 44
44 -
 45
45 -
 46
46 -
 47
47 -
 48
48 -
 49
49 -
 50
50 -
 51
51 -
 52
52 -
 53
53 -
 54
54 -
 55
55 -
 56
56 -
 57
57 -
 58
58 -
 59
59 -
 60
60 -
 61
61 -
 62
62 -
 63
63 -
64
-
65
-
66
-
67
-
68
-
69
-
70
-
71
-
72
-
73
-
74
-
75
-
76
-
77
-
78
-
79
-
80
-
81
-
82
-
83
-
84
-
85
-
86
-
87
-
88
-
89
-
90
-
91
-
92
 |
 |

Sara Lee Corporation and Subsidiaries 51
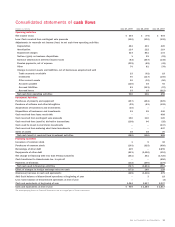
Consolidated statements of cash flows
Dollars in millions June 27, 2009 June 28, 2008 June 30, 2007
Operating Activities
Net income (loss) $÷«364 $«««««(79) $««««504
Less: Cash received from contingent sale proceeds (150) (130) (120)
Adjustments to reconcile net income (loss) to net cash from operating activities
Depreciation 383 403 420
Amortization 114 122 119
Impairment charges 314 851 172
Net loss (gain) on business dispositions 1 25 (29)
Increase (decrease) in deferred income taxes (83) (267) (138)
Pension payments, net of expense (232) (68) (43)
Other 70 81 (39)
Change in current assets and liabilities, net of businesses acquired and sold
Trade accounts receivable 23 (92) 18
Inventories 90 (117) (106)
Other current assets 16 (36) (50)
Accounts payable (126) 38 93
Accrued liabilities 83 (143) (97)
Accrued taxes 33 18 (212)
Net cash from operating activities 900 606 492
Investment Activities
Purchases of property and equipment (357) (454) (529)
Purchase of software and other intangibles (22) (61) (102)
Acquisitions of businesses and investments (10) – –
Dispositions of businesses and investments 53 55 346
Cash received from loans receivable – – 688
Cash received from contingent sale proceeds 150 130 120
Cash received from (used in) derivative transactions (138) 96 (25)
Cash used to invest in short-term investments – – (647)
Cash received from maturing short-term investments – – 647
Sales of assets 38 38 70
Net cash (used in) received from investment activities (286) (196) 568
Financing Activities
Issuances of common stock 1538
Purchases of common stock (103) (315) (686)
Borrowings of other debt 439 – 2,895
Repayments of other debt (541) (1,456) (416)
Net change in financing with less than 90-day maturities (261) 251 (1,720)
Cash transferred to Hanesbrands Inc. in spin off – – (650)
Payments of dividends (302) (296) (374)
Net cash used in financing activities (767) (1,811) (913)
Effect of changes in foreign exchange rates on cash (172) 165 128
(Decrease) increase in cash and equivalents (325) (1,236) 275
Add: Cash balance of discontinued operations at beginning of year –318
Less: Cash balance of discontinued operations at end of year – – (3)
Cash and equivalents at beginning of year 1,284 2,517 2,227
Cash and equivalents at end of year $÷«959 $«1,284 $«2,517
The accompanying Notes to Financial Statements are an integral part of these statements.