Sara Lee 2009 Annual Report Download - page 68
Download and view the complete annual report
Please find page 68 of the 2009 Sara Lee annual report below. You can navigate through the pages in the report by either clicking on the pages listed below, or by using the keyword search tool below to find specific information within the annual report.-
 1
1 -
2
-
3
-
4
-
5
-
6
-
7
-
8
-
9
-
10
-
11
-
12
-
13
-
14
-
15
-
16
-
17
-
18
-
19
-
20
-
21
-
22
-
23
-
24
-
25
-
26
-
27
-
28
-
29
-
30
-
31
-
32
-
33
-
34
-
35
-
36
-
37
-
38
-
39
-
40
-
41
-
42
-
43
-
44
-
45
-
46
-
47
-
48
-
49
-
50
-
51
-
52
-
53
-
54
-
55
-
56
-
57
-
 58
58 -
 59
59 -
 60
60 -
 61
61 -
 62
62 -
 63
63 -
 64
64 -
 65
65 -
 66
66 -
 67
67 -
 68
68 -
 69
69 -
 70
70 -
 71
71 -
 72
72 -
 73
73 -
 74
74 -
 75
75 -
 76
76 -
 77
77 -
 78
78 -
79
-
80
-
81
-
82
-
83
-
84
-
85
-
86
-
87
-
88
-
89
-
90
-
91
-
92
 |
 |

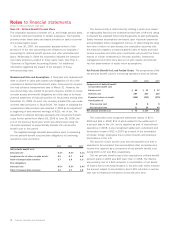
Notes to financial statements
Dollars in millions except per share data
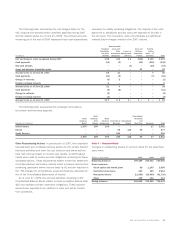
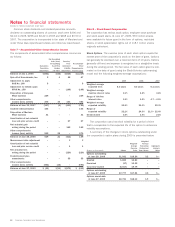
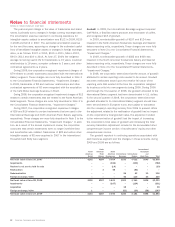
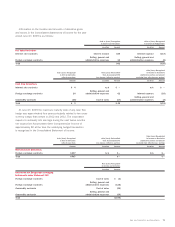
Note 12 – Long-Term Debt
The composition of the corporation’s long-term debt, which includes
capital lease obligations, is summarized in the following table:
Maturity Date 2009 2008
Senior debt – fixed rate
6.5% notes 2009 $÷÷÷«– $÷«150
7.05% – 7.71% notes 2010 25 25
6.25% notes 2012 1,110 1,110
3.875% notes 2013 500 500
10% zero coupon notes 2014 12 11
10% – 14.25% zero coupon notes 2015 57 50
6.125% notes 2033 500 500
Total senior debt 2,204 2,346
Senior debt – variable rate
Euro denominated – euro interbank offered
rate (EURIBOR) plus .10% 2009 – 394
Euro denominated – euro interbank offered
rate (EURIBOR) plus 1.75% 2011 399 –
Total senior debt 2,603 2,740
Obligations under capital lease 60 61
Other debt 119 103
Total debt 2,782 2,904
Unamortized discounts (7) (6)
Hedged debt adjustment to fair value 25 10
Total long-term debt 2,800 2,908
Less current portion 55 568
$2,745 $2,340
Payments required on long-term debt during the years ending 2010
through 2014 are $55, $425, $1,164, $528 and $25, respectively.
The corporation made cash interest payments of $174, $249 and
$266 in 2009, 2008 and 2007, respectively.
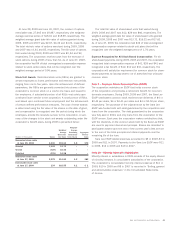
Note 13 – Leases
The corporation leases certain facilities, equipment and vehicles
under agreements that are classified as either operating or capital
leases. The building leases have original terms that range from 10
to 15 years, while the equipment and vehicle leases have terms of
generally less than seven years. The gross book value of capital lease
assets included in property at June 27, 2009 and June 28, 2008
was $130 and $118, respectively. The net book value of capital
lease assets included in property at June 27, 2009 and June 28,
2008 was $60 and $61, respectively.
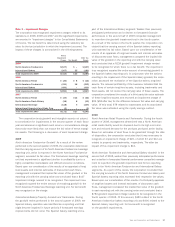
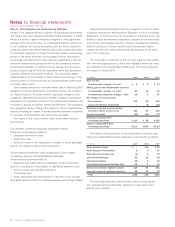
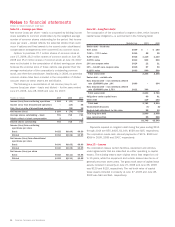
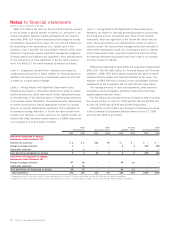
Note 11 – Earnings per Share
Net income (loss) per share – basic is computed by dividing income
(loss) available to common stockholders by the weighted average
number of common shares outstanding for the period. Net income
(loss) per share – diluted reflects the potential dilution that could
occur if options and fixed awards to be issued under stock-based
compensation arrangements were converted into common stock.
Options to purchase 27.7 million shares of common stock at
June 27, 2009, 28.2 million shares of common stock at June 28,
2008 and 35.2 million shares of common stock at June 30, 2007
were not included in the computation of diluted earnings per share
because the exercise price of these options was greater than the
average market price of the corporation’s outstanding common
stock, and therefore anti-dilutive. Additionally, in 2008, no potential
common shares have been included in the computation of diluted
loss per share as these shares are anti-dilutive.
The following is a reconciliation of net income (loss) to net
income (loss) per share – basic and diluted − for the years ended
June 27, 2009, June 28, 2008 and June 30, 2007:
Shares in millions 2009 2008 2007
Income (loss) from continuing operations $«364 $«««(41) $«440
Income (loss) from discontinued operations – (14) 48
Gain (loss) on sale of discontinued operations – (24) 16
Net income (loss) $«364 $«««(79) $«504
Average shares outstanding – basic 701 715 741
Dilutive effect of stock compensation 2–2
Diluted shares outstanding 703 715 743
Income (loss) from continuing
operations per share
Basic $0.52 $(0.06) $0.59
Diluted $0.52 $(0.06) $0.59
Net income (loss) from discontinued
operations per share
Basic $0.00 $(0.05) $0.09
Diluted $0.00 $(0.05) $0.09
Net income (loss) per share
Basic $0.52 $(0.11) $0.68
Diluted $0.52 $(0.11) $0.68
66 Sara Lee Corporation and Subsidiaries