Sara Lee 2009 Annual Report Download - page 22
Download and view the complete annual report
Please find page 22 of the 2009 Sara Lee annual report below. You can navigate through the pages in the report by either clicking on the pages listed below, or by using the keyword search tool below to find specific information within the annual report.-
 1
1 -
2
-
3
-
4
-
5
-
6
-
7
-
8
-
9
-
10
-
11
-
 12
12 -
 13
13 -
 14
14 -
 15
15 -
 16
16 -
 17
17 -
 18
18 -
 19
19 -
 20
20 -
 21
21 -
 22
22 -
 23
23 -
 24
24 -
 25
25 -
 26
26 -
 27
27 -
 28
28 -
 29
29 -
 30
30 -
 31
31 -
 32
32 -
33
-
34
-
35
-
36
-
37
-
38
-
39
-
40
-
41
-
42
-
43
-
44
-
45
-
46
-
47
-
48
-
49
-
50
-
51
-
52
-
53
-
54
-
55
-
56
-
57
-
58
-
59
-
60
-
61
-
62
-
63
-
64
-
65
-
66
-
67
-
68
-
69
-
70
-
71
-
72
-
73
-
74
-
75
-
76
-
77
-
78
-
79
-
80
-
81
-
82
-
83
-
84
-
85
-
86
-
87
-
88
-
89
-
90
-
91
-
92
 |
 |

Financial review
20 Sara Lee Corporation and Subsidiaries
Bakery, which remained virtually unchanged. The results reflect the
favorable impact of savings from continuous improvement initiatives
and lower MAP expenses.
Total SG&A expenses reported in 2009 by the business seg-
ments decreased by $253 million, or 6.7%, versus 2008 primarily
due to the impact of changes in foreign currency exchange rates,
lower media advertising and promotion spending and the benefits
of cost savings initiatives partially offset by the impact of inflation
on wages and employee benefits.
Amortization of intangibles decreased by $2 million in 2009
versus 2008. General corporate expenses, which are not allocated
to the individual business segments, increased by $8 million due
to unrealized mark-to-market losses on commodity derivatives of
$11 million in 2009 as compared to gains of $16 million in the prior
year. Other general corporate expenses decreased $19 million versus
the prior year due to lower pension costs and favorable foreign
currency transactions partially offset by increased professional fees
for consulting and special project work. General corporate expenses
were also favorably impacted by approximately $22 million related
to certain nonrecurring items – primarily a non-income related foreign
tax refund and a reduction in contingent lease accruals.
Total SG&A expenses in 2008 increased $134 million, or 3.4%.
Changes in foreign currency exchange rates, primarily in the European
euro, increased SG&A expenses by $213 million, or 5.3%. The
remaining decrease in SG&A expenses was $79 million, or 1.9%.
Measured as a percent of sales, SG&A expenses decreased from
32.6% in 2007 to 30.6% in 2008. SG&A expenses as a percent
of sales declined in each of the business segments. The results
reflect the favorable impact of savings from continuous improvement
initiatives, a $67 million reduction in transformation related costs
and lower general corporate expenses.
Total SG&A expenses reported in 2008 by the business segments
increased by $260 million, or 7.5%, over 2007 primarily due to the
impact of changes in foreign currency exchange rates, higher distri-
bution costs driven by higher fuel costs, and the impact of inflation
on wages and employee benefit costs, partially offset by the benefits
of cost savings initiatives and lower costs associated with the
corporation’s transformation program.
Amortization of intangibles increased by $3 million in 2008 versus
2007. General corporate expenses decreased by $129 million as
compared to the prior year, due to a reduction in business transfor-
mation costs, lower pension and other benefit plan costs, the
non-recurrence of costs related to corporate hedging programs and
$16 million of unrealized mark-to-market gains associated with
derivatives in 2008.
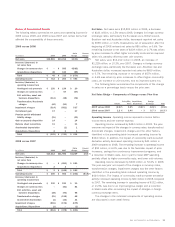
Gross Margin The gross margin, which represents net sales less
cost of sales, decreased by $275 million in 2009, driven by higher
commodity costs, the negative impact of changes in currency exchange
rates, and lower unit volumes partially offset by price increases and
savings from continuous improvement programs.
The gross margin percent declined from 38.3% in 2008 to 37.1%
in 2009 due to gross margin percent declines at North American
Fresh Bakery, International Beverage and Household and Body
Care. The gross margin percent was negatively impacted by higher
commodity costs, the negative impact of inflation on labor and other
employee benefit costs and a shift in product sales mix, which
was partially offset by pricing actions.
The gross margin increased by $445 million in 2008, driven by the
favorable impact of changes in currency exchange rates, price increases
to offset higher commodity costs, higher unit volumes, and savings
from continuous improvement programs, partially offset by higher
commodity costs and higher labor costs due to inflationary pressures.
The gross margin percent declined from 38.5% in 2007 to 38.3%
in 2008. The gross margin percent declined in each business seg-
ment with the exception of North American Retail. The gross margin
percent was negatively impacted by higher commodity costs and
inflation, which was partially offset by price increases.
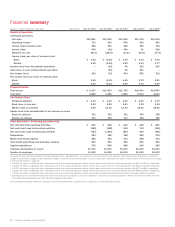
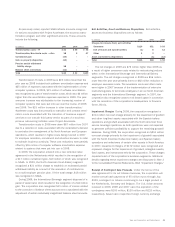
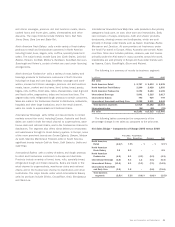
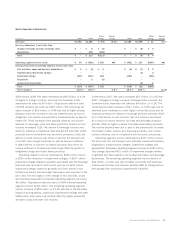
Selling, General and Administrative Expenses
In millions 2009 2008 2007
SG&A expenses in the business
segment results
Media advertising and promotion $÷«503 $÷«594 $÷«567
Other 2,993 3,155 2,922
Total business segments 3,496 3,749 3,489
Amortization of identifiable intangibles 65 67 64
General corporate expenses
Other 220 239 352
Mark-to-market derivative
(gains)/losses 11 (16) –
Total $3,792 $4,039 $3,905
Total selling, general and administrative (SG&A) expenses in
2009 decreased $247 million, or 6.1%. Changes in foreign cur-
rency exchange rates, primarily in the European euro, decreased
SG&A expenses by $177 million, or 4.3%. The remaining decrease
in SG&A expenses was $70 million, or 1.8%. Measured as a per-
cent of sales, SG&A expenses decreased from 30.6% in 2008 to
29.4% in 2009. SG&A expenses as a percent of sales declined in
each of the business segments, with the exception of International