Sara Lee 2009 Annual Report Download - page 16
Download and view the complete annual report
Please find page 16 of the 2009 Sara Lee annual report below. You can navigate through the pages in the report by either clicking on the pages listed below, or by using the keyword search tool below to find specific information within the annual report.-
 1
1 -
2
-
3
-
4
-
5
-
 6
6 -
 7
7 -
 8
8 -
 9
9 -
 10
10 -
 11
11 -
 12
12 -
 13
13 -
 14
14 -
 15
15 -
 16
16 -
 17
17 -
 18
18 -
 19
19 -
 20
20 -
 21
21 -
 22
22 -
 23
23 -
 24
24 -
 25
25 -
 26
26 -
27
-
28
-
29
-
30
-
31
-
32
-
33
-
34
-
35
-
36
-
37
-
38
-
39
-
40
-
41
-
42
-
43
-
44
-
45
-
46
-
47
-
48
-
49
-
50
-
51
-
52
-
53
-
54
-
55
-
56
-
57
-
58
-
59
-
60
-
61
-
62
-
63
-
64
-
65
-
66
-
67
-
68
-
69
-
70
-
71
-
72
-
73
-
74
-
75
-
76
-
77
-
78
-
79
-
80
-
81
-
82
-
83
-
84
-
85
-
86
-
87
-
88
-
89
-
90
-
91
-
92
 |
 |

14 Sara Lee Corporation and Subsidiaries
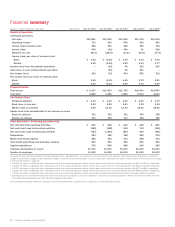
Financial summary
Dollars in millions except per share data Years ended June 27, 2009 1June 28, 2008 2June 30, 2007 3July 1, 20064July 2, 2005 5
Results of Operations
Continuing operations
Net sales $12,881 $13,212 $11,983 $11,175 $11,115
Operating income6713 260 562 416 943
Income before income taxes 588 160 429 189 746
Income (loss) 364 (41) 440 31 616
Effective tax rate 38.1% 125.6% (2.6) % 83.6% 17.5%
Income (loss) per share of common stock
Basic $÷÷0.52 $«÷(0.06) $÷÷0.59 $÷÷0.04 $÷÷0.78
Diluted 0.52 (0.06) 0.59 0.04 0.77
Income (loss) from discontinued operations – (14) 48 123 103
Gain (loss) on sale of discontinued operations – (24) 16 401 –
Net income (loss) 364 (79) 504 555 719
Net income (loss) per share of common stock
Basic 0.52 (0.11) 0.68 0.72 0.91
Diluted 0.52 (0.11) 0.68 0.72 0.90
Financial Position
Total assets $÷9,417 $10,830 $11,755 $14,660 $14,540
Total debt 2,820 3,188 4,220 5,914 4,613
Per Common Share
Dividends declared $÷÷0.44 $÷÷0.42 $÷÷0.50 $÷÷0.59 $÷÷0.79
Book value at year-end 2.93 3.98 3.51 3.22 3.28
Market value at year-end 9.58 12.18 17.40 16.02 19.65
Shares used in the determination of net income per share
Basic (in millions) 701 715 741 766 789
Diluted (in millions) 703 715 743 768 796
Other Information – Continuing Operations Only
Net cash flow from operating activities $÷÷«900 $÷÷«596 $÷÷«404 $÷«÷405 $÷÷«521
Net cash from (used in) investing activities (286) (188) 615 704 (123)
Net cash from (used in) financing activities (767) (1,806) (857) 509 (491)
Depreciation 383 398 395 389 375
Media advertising expense 282 325 313 298 333
Total media advertising and promotion expense 503 594 566 531 546
Capital expenditures 379 509 598 438 395
Common stockholders of record 67,000 70,000 76,000 82,000 87,000
Number of employees 41,000 44,000 46,000 50,000 50,000
The amounts above include the impact of certain significant items. Significant items may include, but are not limited to: exit activities, asset and business dispositions, impairment
charges, transformation charges, Project Accelerate charges, settlement and curtailment gains or losses, and various significant tax matters. Further details of these items are included
in the Financial Review on page 18.
1In 2009, the impact of significant items decreased income from continuing operations before income taxes and income from continuing operations by $461 and $374, respectively.
2In 2008, the impact of significant items decreased income from continuing operations before income taxes and income from continuing operations by $941 and $759, respectively.
3In 2007, the impact of significant items decreased income from continuing operations before income taxes and income from continuing operations by $417 and $85, respectively.
4In 2006, the impact of significant items decreased income from continuing operations before income taxes and income from continuing operations by $468 and $220, respectively.
5In 2005, the impact of significant items decreased income from continuing operations before income taxes by $54 and increased income from continuing operations by $169.
6Operating income is reconciled between the income from each of the corporation’s business segments to income from continuing operations before income taxes in Note 22 of the
Consolidated Financial Statements titled, “Business Segment Information.”
The Consolidated Financial Statements and Notes and the Financial Review should be read in conjunction with the Financial Summary.