Sara Lee 2009 Annual Report Download - page 21
Download and view the complete annual report
Please find page 21 of the 2009 Sara Lee annual report below. You can navigate through the pages in the report by either clicking on the pages listed below, or by using the keyword search tool below to find specific information within the annual report.-
 1
1 -
2
-
3
-
4
-
5
-
6
-
7
-
8
-
9
-
10
-
 11
11 -
 12
12 -
 13
13 -
 14
14 -
 15
15 -
 16
16 -
 17
17 -
 18
18 -
 19
19 -
 20
20 -
 21
21 -
 22
22 -
 23
23 -
 24
24 -
 25
25 -
 26
26 -
 27
27 -
 28
28 -
 29
29 -
 30
30 -
 31
31 -
32
-
33
-
34
-
35
-
36
-
37
-
38
-
39
-
40
-
41
-
42
-
43
-
44
-
45
-
46
-
47
-
48
-
49
-
50
-
51
-
52
-
53
-
54
-
55
-
56
-
57
-
58
-
59
-
60
-
61
-
62
-
63
-
64
-
65
-
66
-
67
-
68
-
69
-
70
-
71
-
72
-
73
-
74
-
75
-
76
-
77
-
78
-
79
-
80
-
81
-
82
-
83
-
84
-
85
-
86
-
87
-
88
-
89
-
90
-
91
-
92
 |
 |

Sara Lee Corporation and Subsidiaries 19
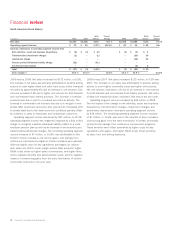
Net Sales Net sales were $12,881 million in 2009, a decrease
of $331 million, or 2.5% versus 2008. Changes in foreign currency
exchange rates, particularly the European euro, British pound,
Brazilian real and Australian dollar, decreased reported net sales
by $585 million, or 4.6%. Dispositions net of acquisition after the
beginning of 2008 reduced net sales by $85 million, or 0.6%. The
remaining increase in net sales of $339 million, or 2.7% was driven
by price increases to offset higher commodity costs and an improved
sales mix, partially offset by lower unit volumes.
Net sales were $13,212 million in 2008, an increase of
$1,229 million, or 10.3%, over 2007. Changes in foreign currency
exchange rates, particularly the European euro, Brazilian real and
Australian dollar, increased reported net sales by $650 million,
or 5.7%. The remaining increase in net sales of $579 million,
or 4.6% was driven by price increases to offset higher commodity
costs, an increase in unit volumes, and an improved sales mix.
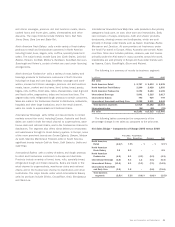
The following table summarizes the components of the change
in sales on a percentage basis versus the prior year:
Net Sales Bridge – Components of Change versus Prior Year
Price/Mix/ Acquisitions/ Foreign
Volume Other Dispositions Exchange Total
2009 versus 2008 (2.5) % 5.2% (0.6) % (4.6) % (2.5) %
2008 versus 2007 1.2 % 3.4% – % 5.7 % 10.3 %
Operating Income Operating income represents income before
income taxes and net interest expense.
Operating income increased by $453 million in 2009. The year-
over-year net impact of the changes in currency rates, transformation/
Accelerate charges, impairment charges and the other factors
identified in the preceding table increased operating income by
$434 million. In addition, the impact of commodity mark-to-market
derivative activity decreased operating income by $40 million in
2009 compared to 2008. The remaining increase in operating income
of $59 million, or 6.0%, was due to the favorable impact of price
increases, savings from continuous improvement programs, and
a reduction in SG&A costs, due in part to lower MAP spending
partially offset by higher commodity costs, and lower unit volumes.
Operating income decreased by $302 million, or 53.6%, in 2008.
The year-over-year net impact of the changes in currency rates,
transformation charges, impairment charges and the other factors
identified in the preceding table reduced operating income by
$434 million. The impact of commodity mark-to-market derivative
activity increased operating income by $20 million in 2008 compared
to 2007. The remaining increase in operating income of $112 million,
or 11.9%, was due to an improved gross margin and a reduction
in SG&A costs after considering the impact of changes in foreign
currency exchange rates.
The changes in the individual components of operating income
are discussed in more detail below.
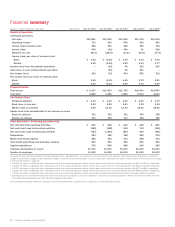
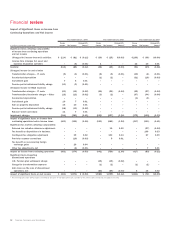
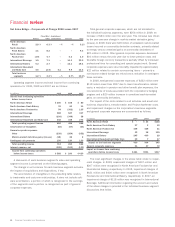
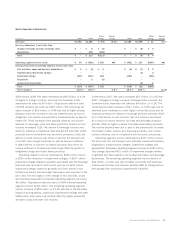
Review of Consolidated Results
The following tables summarize net sales and operating income for
2009 versus 2008, and 2008 versus 2007 and certain items that
affected the comparability of these amounts:
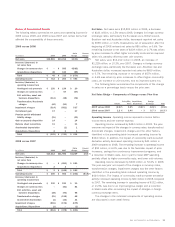
2009 versus 2008
Dollar Percent
In millions 2009 2008 Change Change
Net sales $12,881 $13,212 $(331) (2.5) %
Increase/(decrease) in
net sales from
Changes in currency rates $««÷÷«÷– $«÷÷585 $(585)
Acquisitions/dispositions 45 130 (85)
Total $«÷÷÷45 $«÷÷715 $÷(670)
Operating income $«÷÷713 $«÷÷260 $«÷453 NM
Increase/(decrease) in
operating income from
Contingent sale proceeds $«÷÷150 $«÷÷130 $«««÷20
Changes in currency rates – 67 (67)
Exit activities, asset and
business dispositions (114) (38) (76)
Transformation/Accelerate
charges (44) (51) 7
Impairment charges (314) (851) 537
Curtailment gain 17 – 17
Pension partial withdrawal
liability charge (31) – (31)
Gain on property disposition 14 – 14
Balance sheet corrections 11 – 11
Accelerated depreciation –(1) 1
Acquisitions/dispositions 2 1 1
Total $««÷(309) $««÷(743) $÷«434
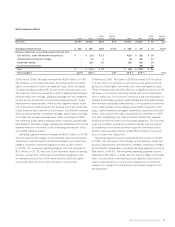
2008 versus 2007
Dollar Percent
In millions 2008 2007 Change Change
Net sales $13,212 $11,983 $1,229 10.3 %
Increase/(decrease) in
net sales from
Changes in currency rates $«÷÷÷÷– $÷÷(650) $«÷650
Acquisitions/dispositions 22–
Total $«÷÷÷÷2 $÷÷(648) $«÷650
Operating income $«÷÷260 $÷«÷562 $÷(302) (53.6) %
Increase/(decrease) in
operating income from
Contingent sale proceeds $«÷÷130 $÷«÷120 $«÷÷10
Changes in currency rates – (81) 81
Exit activities, asset and
business dispositions (38) (94) 56
Transformation charges (51) (119) 68
Accelerated depreciation (1) (32) 31
Impairment charges (851) (172) (679)
Acquisitions/dispositions (1) – (1)
Total $÷÷(812) $÷÷(378) $÷(434)