Pitney Bowes 2009 Annual Report Download - page 98
Download and view the complete annual report
Please find page 98 of the 2009 Pitney Bowes annual report below. You can navigate through the pages in the report by either clicking on the pages listed below, or by using the keyword search tool below to find specific information within the annual report.-
 1
1 -
2
-
3
-
4
-
5
-
6
-
7
-
8
-
9
-
10
-
11
-
12
-
13
-
14
-
15
-
16
-
17
-
18
-
19
-
20
-
21
-
22
-
23
-
24
-
25
-
26
-
27
-
28
-
29
-
30
-
31
-
32
-
33
-
34
-
35
-
36
-
37
-
38
-
39
-
40
-
41
-
42
-
43
-
44
-
45
-
46
-
47
-
48
-
49
-
50
-
51
-
52
-
53
-
54
-
55
-
56
-
57
-
58
-
59
-
60
-
61
-
62
-
63
-
64
-
65
-
66
-
67
-
68
-
69
-
70
-
71
-
72
-
73
-
74
-
75
-
76
-
77
-
78
-
79
-
80
-
81
-
82
-
83
-
84
-
85
-
86
-
87
-
 88
88 -
 89
89 -
 90
90 -
 91
91 -
 92
92 -
 93
93 -
 94
94 -
 95
95 -
 96
96 -
 97
97 -
 98
98 -
 99
99 -
 100
100 -
 101
101 -
 102
102 -
 103
103 -
 104
104 -
 105
105 -
 106
106 -
 107
107 -
 108
108 -
109
-
110
-
111
-
112
-
113
-
114
-
115
-
116
-
117
-
118
-
119
-
120
-
121
-
122
-
123
-
124
 |
 |

PITNEY BOWES INC.
NOTES TO CONSOLIDATED FINANCIAL STATEMENTS
(Tabular dollars in thousands, except per share data)
80
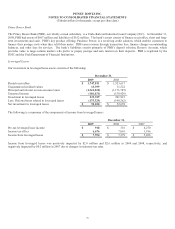
December 31,
2009 2008
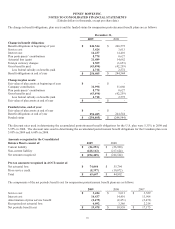
Identifiable assets:
U.S. Mailing $ 2,948,520 $ 3,092,653
International Mailing 1,677,082 1,688,275
Production Mail 617,483 594,646
Software 944,248 994,491
Mailstream Solutions 6,187,333 6,370,065
Management Services 879,390 905,410
Mail Services 516,274 508,308
Marketing Services 234,216 293,322
Mailstream Services 1,629,880 1,707,040
Total $ 7,817,213 $ 8,077,105
Identifiable long-lived assets by geographic areas:
United States $ 2,846,443 $ 3,013,369
Outside the United States 909,099 1,057,967
Total $ 3,755,542 $ 4,071,336
Reconciliation of Segment Amounts to Consolidated Totals:
Years ended December 31,
2009 2008 2007
EBIT:
Total EBIT for reportable segments $ 1,137,532 $ 1,345,136 $ 1,379,715
Unallocated amounts:
Interest, net (203,906) (216,450) (241,871)
Corporate expense (187,254) (209,543) (210,544)
Restructuring charges and asset impairments (48,746) (200,254) (264,013)
Other items (4,450) (5,712) (2,576)
Income from continuing operations before income taxes $ 693,176 $ 713,177 $ 660,711
Depreciation and amortization:
Total depreciation and amortization
for reportable segments $ 319,183 $ 360,231 $ 368,431
Corporate depreciation 19,712 18,886 14,710
Consolidated depreciation and amortization $ 338,895 $ 379,117 $ 383,141
Capital expenditures:
Total additions for reportable segments $ 151,257 $ 222,614 $ 242,133
Unallocated amounts 15,471 14,694 22,523
Consolidated capital expenditures $ 166,728 $ 237,308 $ 264,656
December 31,
2009 2008
Total assets:
Total identifiable assets by reportable segments $ 7,817,213 $ 8,077,105
Cash and cash equivalents and short-term investments 427,419 398,222
General corporate assets 289,279 334,909
Consolidated assets $ 8,533,911 $ 8,810,236