Pitney Bowes 2009 Annual Report Download - page 37
Download and view the complete annual report
Please find page 37 of the 2009 Pitney Bowes annual report below. You can navigate through the pages in the report by either clicking on the pages listed below, or by using the keyword search tool below to find specific information within the annual report.-
 1
1 -
2
-
3
-
4
-
5
-
6
-
7
-
8
-
9
-
10
-
11
-
12
-
13
-
14
-
15
-
16
-
17
-
18
-
19
-
20
-
21
-
22
-
23
-
24
-
25
-
26
-
 27
27 -
 28
28 -
 29
29 -
 30
30 -
 31
31 -
 32
32 -
 33
33 -
 34
34 -
 35
35 -
 36
36 -
 37
37 -
 38
38 -
 39
39 -
 40
40 -
 41
41 -
 42
42 -
 43
43 -
 44
44 -
 45
45 -
 46
46 -
 47
47 -
48
-
49
-
50
-
51
-
52
-
53
-
54
-
55
-
56
-
57
-
58
-
59
-
60
-
61
-
62
-
63
-
64
-
65
-
66
-
67
-
68
-
69
-
70
-
71
-
72
-
73
-
74
-
75
-
76
-
77
-
78
-
79
-
80
-
81
-
82
-
83
-
84
-
85
-
86
-
87
-
88
-
89
-
90
-
91
-
92
-
93
-
94
-
95
-
96
-
97
-
98
-
99
-
100
-
101
-
102
-
103
-
104
-
105
-
106
-
107
-
108
-
109
-
110
-
111
-
112
-
113
-
114
-
115
-
116
-
117
-
118
-
119
-
120
-
121
-
122
-
123
-
124
 |
 |

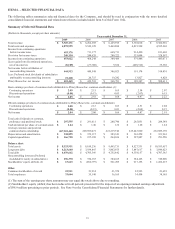
19
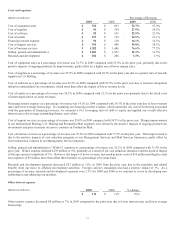
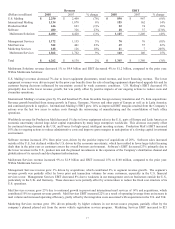
Cost of equipment sales as a percentage of revenue increased to 53.0% in 2008 compared with 52.2% in the prior year, primarily due
to the increase in mix of lower margin equipment sales outside the U.S. and the prior year sales of high margin upgrade kits.
Cost of supplies as a percentage of revenue decreased to 26.5% in 2008 compared with 27.1% in the prior year. This variance is driven
by a change in the mix of business.
Cost of software as a percentage of revenue increased to 23.9% in 2008 compared with 23.7% in the prior year primarily due to a
change in the mix of business.
Cost of rentals as a percentage of revenue decreased to 21.1% in 2008 compared with 23.2% in the prior year primarily due to lower
depreciation costs related to the transition of our product line.
Financing interest expense as a percentage of revenue was 14.3% in 2008 compared with 16.0% in the prior year due to lower interest
rates. In computing our financing interest expense, which represents our cost of borrowing associated with the generation of financing
revenues, we assumed a 10:1 leveraging ratio of debt to equity and applied our overall effective interest rate to the average outstanding
finance receivables.
Cost of support services as a percentage of revenue increased to 58.3% in 2008 compared with 56.9% in the prior year. Improvements
in our Production Mail segment due to the impact of our transition initiatives were more than offset by higher service costs in our U.S.
and International Mailing businesses.
Cost of business services as a percentage of revenue was 77.2% in 2008 compared with 76.9% in the prior year. For Mail Services,
continued integration costs associated with the current year acquisitions of a multi-site presort operation in the U.S. and U.K. were
more than offset by the successful integration of other recently acquired sites and productivity improvements.
Selling, general and administrative expenses, as a percentage of total revenue, remained flat at 31.5%. The benefits gained from our
transition initiatives were offset by lower revenue growth and a shift in the mix of our business as well as higher credit loss expenses
in the U.S. Software, which is continuing to become a larger portion of our overall business, has a relatively higher selling, general
and administrative expense ratio.
Research and development expenses increased $20 million, or 11%, as we continue to invest in developing new technologies,
enhancing our products, and expanding our offshore development capabilities. R&D expenses as a percentage of total revenue
increased to 3.3% in 2008 from 3.0% in 2007.
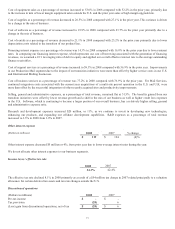
Other interest expense
(Dollars in millions) 2008 2007 % change
$ 119 $ 124 (4)%
Other interest expense decreased $5 million or 4%, from prior year due to lower average interest rates during the year.
We do not allocate other interest expenses to our business segments.
Income taxes / effective tax rate
2008 2007
34.3% 42.4%
The effective tax rate declined 8.1% in 2008 primarily as a result of a $54 million tax charge in 2007 related principally to a valuation
allowance for certain deferred tax assets and tax rate changes outside the U.S.
Discontinued operations
(Dollars in millions) 2008 2007
Pre-tax income $ - $ -
Tax provision (28) 6
(Loss) gain from discontinued operations, net of tax $ (28) $ 6