Pitney Bowes 2009 Annual Report Download - page 60
Download and view the complete annual report
Please find page 60 of the 2009 Pitney Bowes annual report below. You can navigate through the pages in the report by either clicking on the pages listed below, or by using the keyword search tool below to find specific information within the annual report.-
 1
1 -
2
-
3
-
4
-
5
-
6
-
7
-
8
-
9
-
10
-
11
-
12
-
13
-
14
-
15
-
16
-
17
-
18
-
19
-
20
-
21
-
22
-
23
-
24
-
25
-
26
-
27
-
28
-
29
-
30
-
31
-
32
-
33
-
34
-
35
-
36
-
37
-
38
-
39
-
40
-
41
-
42
-
43
-
44
-
45
-
46
-
47
-
48
-
49
-
 50
50 -
 51
51 -
 52
52 -
 53
53 -
 54
54 -
 55
55 -
 56
56 -
 57
57 -
 58
58 -
 59
59 -
 60
60 -
 61
61 -
 62
62 -
 63
63 -
 64
64 -
 65
65 -
 66
66 -
 67
67 -
 68
68 -
 69
69 -
 70
70 -
71
-
72
-
73
-
74
-
75
-
76
-
77
-
78
-
79
-
80
-
81
-
82
-
83
-
84
-
85
-
86
-
87
-
88
-
89
-
90
-
91
-
92
-
93
-
94
-
95
-
96
-
97
-
98
-
99
-
100
-
101
-
102
-
103
-
104
-
105
-
106
-
107
-
108
-
109
-
110
-
111
-
112
-
113
-
114
-
115
-
116
-
117
-
118
-
119
-
120
-
121
-
122
-
123
-
124
 |
 |

42
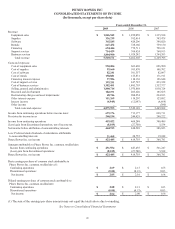
PITNEY BOWES INC.
CONSOLIDATED STATEMENTS OF CASH FLOWS
(In thousands)
Twelve Months Ended December 31,
2009 2008 2007
Cash flows from operating activities:
Net income before attribution of noncontrolling interests $ 444,913 $ 440,548 $ 386,023
Gain on sale of a facility, net of tax - - (1,623)
Restructuring charges and asset impairments, net of tax 31,782 144,211 223,486
Restructuring payments (105,090) (102,680) (31,568)
(Payments) proceeds for settlement of derivative instruments (20,281) 43,991 -
Adjustments to reconcile net income
to net cash provided by operating activities:
Depreciation and amortization 338,895 379,117 383,141
Stock-based compensation 22,523 26,402 24,131
Special pension plan contributions (125,000) - -
Changes in operating assets and liabilities,
excluding effects of acquisitions:
(Increase) decrease in accounts receivables 84,182 (23,690) 35,853
(Increase) decrease in finance receivables 206,823 24,387 (86,238)
(Increase) decrease in inventories 12,187 2,018 7,710
(Increase) decrease in prepaid, deferred expense and other assets (15,036) 6,001 (7,793)
Increase (decrease) in accounts payable and accrued liabilities (127,256) (76,880) 32,789
Increase (decrease) in current and non-current income taxes 85,632 122,480 123,636
Increase (decrease) in advance billings (2,744) 2,051 10,444
Increase (decrease) in other operating capital, net (7,462) 21,459 (20,284)
Net cash provided by operating activities 824,068 1,009,415 1,079,707
Cash flows from investing activities:
Short-term and other investments (8,362) 35,652 42,367
Proceeds from the sale of facilities - - 29,608
Capital expenditures (166,728) (237,308) (264,656)
Net investment in external financing 1,456 1,868 (2,214)
Acquisitions, net of cash acquired - (67,689) (594,110)
Reserve account deposits 1,664 33,359 62,666
Net cash used in investing activities (171,970) (234,118) (726,339)
Cash flows from financing activities:
(Decrease) increase in notes payable, net (389,666) 205,590 (89,673)
Proceeds from long-term obligations 297,513 245,582 640,765
Principal payments on long-term obligations (150,000) (576,565) (174,191)
Proceeds from issuance of common stock 11,962 20,154 107,517
Payments to redeem preferred stock issued by a subsidiary (375,000) (10,000) -
Proceeds from issuance of preferred stock by a subsidiary 296,370 - -
Stock repurchases - (333,231) (399,996)
Dividends paid to common stockholders (297,555) (291,611) (288,790)
Dividends paid to noncontrolling interests (19,485) (20,755) (19,242)
Net cash used in financing activities (625,861) (760,836) (223,610)
Effect of exchange rate changes on cash and cash equivalents 9,829 (14,966) 8,316
Increase (decrease) in cash and cash equivalents 36,066 (505) 138,074
Cash and cash equivalents at beginning of period 376,671 377,176 239,102
Cash and cash equivalents at end of period $ 412,737 $ 376,671 $ 377,176
Cash interest paid $ 195,256 $ 235,816 $ 236,697
Cash income taxes paid, net $ 197,925 $ 164,354 $ 178,469
See Notes to Consolidated Financial Statements