Pitney Bowes 2009 Annual Report Download - page 113
Download and view the complete annual report
Please find page 113 of the 2009 Pitney Bowes annual report below. You can navigate through the pages in the report by either clicking on the pages listed below, or by using the keyword search tool below to find specific information within the annual report.-
 1
1 -
2
-
3
-
4
-
5
-
6
-
7
-
8
-
9
-
10
-
11
-
12
-
13
-
14
-
15
-
16
-
17
-
18
-
19
-
20
-
21
-
22
-
23
-
24
-
25
-
26
-
27
-
28
-
29
-
30
-
31
-
32
-
33
-
34
-
35
-
36
-
37
-
38
-
39
-
40
-
41
-
42
-
43
-
44
-
45
-
46
-
47
-
48
-
49
-
50
-
51
-
52
-
53
-
54
-
55
-
56
-
57
-
58
-
59
-
60
-
61
-
62
-
63
-
64
-
65
-
66
-
67
-
68
-
69
-
70
-
71
-
72
-
73
-
74
-
75
-
76
-
77
-
78
-
79
-
80
-
81
-
82
-
83
-
84
-
85
-
86
-
87
-
88
-
89
-
90
-
91
-
92
-
93
-
94
-
95
-
96
-
97
-
98
-
99
-
100
-
101
-
102
-
 103
103 -
 104
104 -
 105
105 -
 106
106 -
 107
107 -
 108
108 -
 109
109 -
 110
110 -
 111
111 -
 112
112 -
 113
113 -
 114
114 -
 115
115 -
 116
116 -
 117
117 -
 118
118 -
 119
119 -
 120
120 -
 121
121 -
 122
122 -
 123
123 -
124
 |
 |

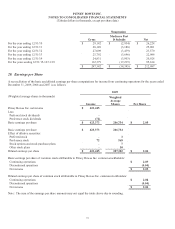
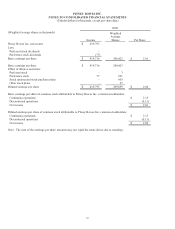
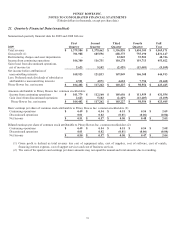
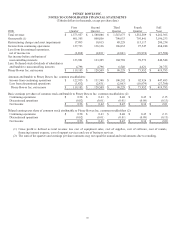
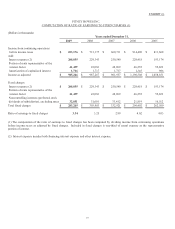
PITNEY BOWES INC.
NOTES TO CONSOLIDATED FINANCIAL STATEMENTS
(Tabular dollars in thousands, except per share data)
95
2008
First
Quarter Second
Quarter Third
Quarter Fourth
Quarter Full
Year
Total revenue $ 1,573,957 $ 1,588,086 $ 1,547,673 $ 1,552,589 $ 6,262,305
Gross profit (1) 801,503 808,856 790,033 795,841 3,196,233
Restructuring charges and asset impairments 17,093 18,815 49,229 115,117 200,254
Income from continuing operations 127,733 136,136 106,832 97,547 468,248
Loss from discontinued operations,
net of income tax (3,832) (2,831) (2,063) (18,974) (27,700)
Net income before attribution of
noncontrolling interests 123,901 133,305 104,769 78,573 440,548
Less: Preferred stock dividends of subsidiaries
attributable to noncontrolling interests 4,798 4,796 6,540 4,621 20,755
Pitney Bowes Inc. net income $ 119,103 $ 128,509 $ 98,229 $ 73,952 $ 419,793
Amounts attributable to Pitney Bowes Inc. common stockholders:
Income from continuing operations $ 122,935 $ 131,340 $ 100,292 $ 92,926 $ 447,493
Loss from discontinued operations (3,832) (2,831) (2,063) (18,974) (27,700)
Pitney Bowes Inc. net income $ 119,103 $ 128,509 $ 98,229 $ 73,952 $ 419,793
Basic earnings per share of common stock attributable to Pitney Bowes Inc. common stockholders (2):
Continuing operations $ 0.58 $ 0.63 $ 0.48 $ 0.45 $ 2.15
Discontinued operations (0.02) (0.01) (0.01) (0.09) (0.13)
Net Income $ 0.56 $ 0.62 $ 0.47 $ 0.36 $ 2.01
Diluted earnings per share of common stock attributable to Pitney Bowes Inc. common stockholders (2):
Continuing operations $ 0.58 $ 0.63 $ 0.48 $ 0.45 $ 2.13
Discontinued operations (0.02) (0.01) (0.01) (0.09) (0.13)
Net Income $ 0.56 $ 0.61 $ 0.47 $ 0.36 $ 2.00
(1) Gross profit is defined as total revenue less cost of equipment sales, cost of supplies, cost of software, cost of rentals,
financing interest expense, cost of support services and cost of business services.
(2) The sum of the quarters and earnings per share amounts may not equal the annual and total amounts due to rounding.