Pitney Bowes 2009 Annual Report Download - page 27
Download and view the complete annual report
Please find page 27 of the 2009 Pitney Bowes annual report below. You can navigate through the pages in the report by either clicking on the pages listed below, or by using the keyword search tool below to find specific information within the annual report.-
 1
1 -
2
-
3
-
4
-
5
-
6
-
7
-
8
-
9
-
10
-
11
-
12
-
13
-
14
-
15
-
16
-
 17
17 -
 18
18 -
 19
19 -
 20
20 -
 21
21 -
 22
22 -
 23
23 -
 24
24 -
 25
25 -
 26
26 -
 27
27 -
 28
28 -
 29
29 -
 30
30 -
 31
31 -
 32
32 -
 33
33 -
 34
34 -
 35
35 -
 36
36 -
 37
37 -
38
-
39
-
40
-
41
-
42
-
43
-
44
-
45
-
46
-
47
-
48
-
49
-
50
-
51
-
52
-
53
-
54
-
55
-
56
-
57
-
58
-
59
-
60
-
61
-
62
-
63
-
64
-
65
-
66
-
67
-
68
-
69
-
70
-
71
-
72
-
73
-
74
-
75
-
76
-
77
-
78
-
79
-
80
-
81
-
82
-
83
-
84
-
85
-
86
-
87
-
88
-
89
-
90
-
91
-
92
-
93
-
94
-
95
-
96
-
97
-
98
-
99
-
100
-
101
-
102
-
103
-
104
-
105
-
106
-
107
-
108
-
109
-
110
-
111
-
112
-
113
-
114
-
115
-
116
-
117
-
118
-
119
-
120
-
121
-
122
-
123
-
124
 |
 |

9
Group Index, was eliminated from the index for all periods shown since it was acquired by Ricoh Company, Ltd. on November 3,
2008.
Total return for the Peer Group and the S&P 500 Composite Index is based on market capitalization, weighted for each year.
All information is based upon data independently provided to the Company by the Standard & Poor’s Corporation and is derived from
their official total return calculation.
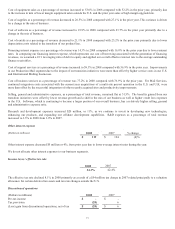
Comparison of Cumulative Five Year Total Return
$0
$20
$40
$60
$80
$100
$120
$140
2004 2005 2006 2007 2008 2009
Pitney Bowes
S&P 500
Peer Group
The graph shows that on a total return basis, assuming reinvestment of all dividends, $100 invested in the company’s common stock
on December 31, 2004 would have been worth $60 on December 31, 2009. By comparison, $100 invested in the S&P 500 Composite
Index on December 31, 2004 would have been worth $102 on December 31, 2009. An investment of $100 in the Peer Group on
December 31, 2004 would have been worth $120 on December 31, 2009.
Indexed Returns
December 31,
Company Name / Index 2004 2005 2006 2007 2008 2009
Pitney Bowes 100 94 106 90 63 60
S&P 500 100 105 121 128 81 102
Peer Group 100 103 123 128 95 120