Pitney Bowes 2009 Annual Report Download - page 34
Download and view the complete annual report
Please find page 34 of the 2009 Pitney Bowes annual report below. You can navigate through the pages in the report by either clicking on the pages listed below, or by using the keyword search tool below to find specific information within the annual report.-
 1
1 -
2
-
3
-
4
-
5
-
6
-
7
-
8
-
9
-
10
-
11
-
12
-
13
-
14
-
15
-
16
-
17
-
18
-
19
-
20
-
21
-
22
-
23
-
 24
24 -
 25
25 -
 26
26 -
 27
27 -
 28
28 -
 29
29 -
 30
30 -
 31
31 -
 32
32 -
 33
33 -
 34
34 -
 35
35 -
 36
36 -
 37
37 -
 38
38 -
 39
39 -
 40
40 -
 41
41 -
 42
42 -
 43
43 -
 44
44 -
45
-
46
-
47
-
48
-
49
-
50
-
51
-
52
-
53
-
54
-
55
-
56
-
57
-
58
-
59
-
60
-
61
-
62
-
63
-
64
-
65
-
66
-
67
-
68
-
69
-
70
-
71
-
72
-
73
-
74
-
75
-
76
-
77
-
78
-
79
-
80
-
81
-
82
-
83
-
84
-
85
-
86
-
87
-
88
-
89
-
90
-
91
-
92
-
93
-
94
-
95
-
96
-
97
-
98
-
99
-
100
-
101
-
102
-
103
-
104
-
105
-
106
-
107
-
108
-
109
-
110
-
111
-
112
-
113
-
114
-
115
-
116
-
117
-
118
-
119
-
120
-
121
-
122
-
123
-
124
 |
 |

16
We do not allocate other interest expense to our business segments.
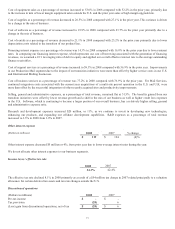
Income taxes / effective tax rate
2009 2008
34.6% 34.3%
The effective tax rate for 2009 included $13 million of tax charges related to the write-off of deferred tax assets associated with the
expiration of out-of-the-money vested stock options and the vesting of restricted stock, offset by $13 million of tax benefits from
retirement of inter-company obligations and the repricing of leveraged lease transactions. The write-off of deferred tax assets will not
require the payment of any taxes. The effective tax rate for 2008 included $12 million of tax increases related to the low tax benefit
associated with restructuring expenses recorded during 2008, offset by adjustments of $10 million related to deferred tax assets
associated with certain U.S. leasing transactions. See Note 9 to the Consolidated Financial Statements for further discussion.
Discontinued operations
(Dollars in millions) 2009 2008
Pre-tax income $21 $ -
Tax provision (29) (28)
Loss from discontinued operations, net of tax $(8) $(28)
The 2009 net loss includes $10 million of pre-tax income ($6 million net of tax) for a bankruptcy settlement received during 2009 and
$11 million of pre-tax income ($7 million net of tax) related to the expiration of an indemnity agreement associated with the sale of a
former subsidiary. This income was more than offset by the accrual of interest on uncertain tax positions. The 2008 net loss of $28
million includes an accrual of tax and interest on uncertain tax positions. See Note 2 to the Consolidated Financial Statements for
further discussion.
Noncontrolling interests (Preferred stock dividends of subsidiaries)
(Dollars in millions) 2009 2008 % change
$ 21 $ 21 3%
Noncontrolling interests includes dividends paid to preferred stockholders in subsidiary companies. 2009 included an expense of $3
million associated with the redemption of $375 million of variable term voting preferred stock during the year. 2008 included a net
expense of $2 million associated with the redemption of $10 million of 9.11% Cumulative Preferred Stock. See Note 10 to the
Consolidated Financial Statements for further discussion.
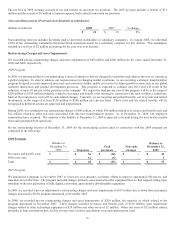
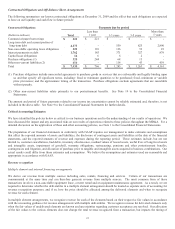
Results of Operations 2008 Compared to 2007
Business segment results
The following table shows revenue and earnings before interest and taxes (“EBIT”) in 2008 and 2007 by business segment. We use
EBIT, a non-GAAP measure, to determine our segment profitability. Refer to the reconciliation of segment amounts to income from
continuing operations before income taxes in Note 18 to the Consolidated Financial Statements.
Results have been reclassified to conform to the current year presentation. Refer to Note 18 to the Consolidated Financial Statements
for further detail on these changes.