Pitney Bowes 2009 Annual Report Download - page 40
Download and view the complete annual report
Please find page 40 of the 2009 Pitney Bowes annual report below. You can navigate through the pages in the report by either clicking on the pages listed below, or by using the keyword search tool below to find specific information within the annual report.-
 1
1 -
2
-
3
-
4
-
5
-
6
-
7
-
8
-
9
-
10
-
11
-
12
-
13
-
14
-
15
-
16
-
17
-
18
-
19
-
20
-
21
-
22
-
23
-
24
-
25
-
26
-
27
-
28
-
29
-
 30
30 -
 31
31 -
 32
32 -
 33
33 -
 34
34 -
 35
35 -
 36
36 -
 37
37 -
 38
38 -
 39
39 -
 40
40 -
 41
41 -
 42
42 -
 43
43 -
 44
44 -
 45
45 -
 46
46 -
 47
47 -
 48
48 -
 49
49 -
 50
50 -
51
-
52
-
53
-
54
-
55
-
56
-
57
-
58
-
59
-
60
-
61
-
62
-
63
-
64
-
65
-
66
-
67
-
68
-
69
-
70
-
71
-
72
-
73
-
74
-
75
-
76
-
77
-
78
-
79
-
80
-
81
-
82
-
83
-
84
-
85
-
86
-
87
-
88
-
89
-
90
-
91
-
92
-
93
-
94
-
95
-
96
-
97
-
98
-
99
-
100
-
101
-
102
-
103
-
104
-
105
-
106
-
107
-
108
-
109
-
110
-
111
-
112
-
113
-
114
-
115
-
116
-
117
-
118
-
119
-
120
-
121
-
122
-
123
-
124
 |
 |

22
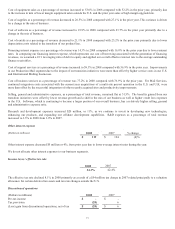
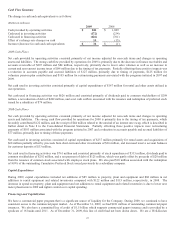
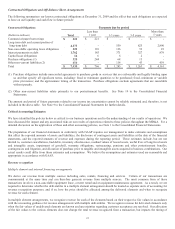
Cash Flow Summary
The change in cash and cash equivalents is as follows:
(Dollars in millions)
2009 2008
Cash provided by operating activities $ 824 $ 1,009
Cash used in investing activities (172) (234)
Cash used in financing activities (626) (761)
Effect of exchange rate changes on cash 10 (15)
Increase (decrease) in cash and cash equivalents $ 36 $ (1)
2009 Cash Flows
Net cash provided by operating activities consisted primarily of net income adjusted for non-cash items and changes in operating
assets and liabilities. The strong cash flow provided by operations for 2009 is primarily due to the decrease in finance receivables and
accounts receivable of $207 million and $84 million, respectively, primarily due to lower sales volumes as well as an increase in
current and non-current income taxes of $86 million due to the timing of tax payments. Partially offsetting these positive impacts was
a reduction in accounts payable and accrued liabilities of $127 million, primarily due to timing of payments, $125 million for
voluntary pension plan contributions and $105 million for restructuring payments associated with the programs initiated in 2007 and
2009.
Net cash used in investing activities consisted primarily of capital expenditures of $167 million for rental and other assets utilized in
our operations.
Net cash used in financing activities was $626 million and consisted primarily of dividends paid to common stockholders of $298
million, a net reduction of debt of $242 million, and a net cash outflow associated with the issuance and redemption of preferred stock
issued by a subsidiary of $79 million.
2008 Cash Flows
Net cash provided by operating activities consisted primarily of net income adjusted for non-cash items and changes in operating
assets and liabilities. The strong cash flow provided by operations for 2008 is primarily due to the timing of tax payments, which
favorably contributed $122 million, and the receipt of $44 million related to the unwind of an interest rate swap, which is described in
further detail in Note 8 to the Consolidated Financial Statements. Partially offsetting these positive impacts were restructuring
payments of $103 million associated with the program initiated in 2007 and a reduction in accounts payable and accrued liabilities of
$77 million, primarily due to timing of these payments.
Net cash used in investing activities consisted of capital expenditures of $237 million primarily for rental assets and acquisitions of
$68 million partially offset by proceeds from short-term and other investments of $36 million, and increased reserve account balances
for customer deposits of $33 million.
Net cash used in financing activities was $761 million and consisted primarily of stock repurchases of $333 million, dividends paid to
common stockholders of $292 million, and a net payment of debt of $125 million, which was partly offset by proceeds of $20 million
from the issuance of common stock associated with employee stock plans. We also paid $10 million associated with the redemption
of 100% of the outstanding Cumulative Preferred Stock issued previously by a subsidiary company.
Capital Expenditures
During 2009, capital expenditures included net additions of $85 million to property, plant and equipment and $82 million in net
additions to rental equipment and related inventories compared with $122 million and $115 million, respectively, in 2008. The
decrease in spend on property, plant and equipment and net additions to rental equipment and related inventories is due to lower new
meter placements in 2009 and tighter control over capital spending.
Financings and Capitalization
We have a commercial paper program that is a significant source of liquidity for the Company. During 2009, we continued to have
consistent access to the commercial paper market. As of December 31, 2009, we had $221 million of outstanding commercial paper
issuances. We also have a committed line of credit of $1.5 billion which supports commercial papers issuance and is provided by a
syndicate of 16 banks until 2011. As of December 31, 2009, this line of credit had not been drawn down. We are a Well-Known