Pitney Bowes 2009 Annual Report Download - page 69
Download and view the complete annual report
Please find page 69 of the 2009 Pitney Bowes annual report below. You can navigate through the pages in the report by either clicking on the pages listed below, or by using the keyword search tool below to find specific information within the annual report.-
 1
1 -
2
-
3
-
4
-
5
-
6
-
7
-
8
-
9
-
10
-
11
-
12
-
13
-
14
-
15
-
16
-
17
-
18
-
19
-
20
-
21
-
22
-
23
-
24
-
25
-
26
-
27
-
28
-
29
-
30
-
31
-
32
-
33
-
34
-
35
-
36
-
37
-
38
-
39
-
40
-
41
-
42
-
43
-
44
-
45
-
46
-
47
-
48
-
49
-
50
-
51
-
52
-
53
-
54
-
55
-
56
-
57
-
58
-
 59
59 -
 60
60 -
 61
61 -
 62
62 -
 63
63 -
 64
64 -
 65
65 -
 66
66 -
 67
67 -
 68
68 -
 69
69 -
 70
70 -
 71
71 -
 72
72 -
 73
73 -
 74
74 -
 75
75 -
 76
76 -
 77
77 -
 78
78 -
 79
79 -
80
-
81
-
82
-
83
-
84
-
85
-
86
-
87
-
88
-
89
-
90
-
91
-
92
-
93
-
94
-
95
-
96
-
97
-
98
-
99
-
100
-
101
-
102
-
103
-
104
-
105
-
106
-
107
-
108
-
109
-
110
-
111
-
112
-
113
-
114
-
115
-
116
-
117
-
118
-
119
-
120
-
121
-
122
-
123
-
124
 |
 |

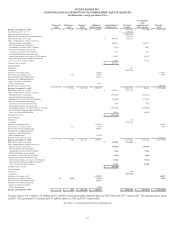
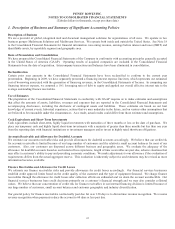
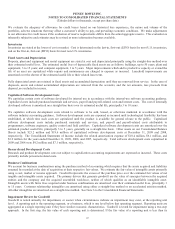
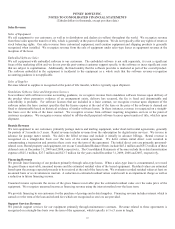
PITNEY BOWES INC.
NOTES TO CONSOLIDATED FINANCIAL STATEMENTS
(Tabular dollars in thousands, except per share data)
51
The following table summarizes selected financial data for the opening balance sheet allocations of the Zipsort, Inc. acquisition in
2008:
2008
Zipsort, Inc.
Purchase price allocation
Current assets $ 708
Other non-current assets 11,707
Intangible assets 7,942
Goodwill 25,294
Current liabilities (2,975)
Non-current liabilities (2,885)
Purchase price, net of cash acquired $ 39,791
Intangible assets
Customer relationships $ 7,658
Non-compete agreements 284
Total intangible assets $ 7,942
Intangible assets amortization period
Customer relationships 15 years
Non-compete agreements 4 years
Total weighted average 15 years
During 2008, we also completed several smaller acquisitions with an aggregate cost of $29.7 million. These acquisitions did not have
a material impact on our financial results.
The amount of tax deductible goodwill added from acquisitions in 2008 was $38.5 million.
Consolidated impact of acquisitions
The Consolidated Financial Statements include the results of operations of the acquired businesses from their respective dates of
acquisition.
The following table provides unaudited pro forma consolidated revenue for the years ended December 31, 2009 and 2008 as if our
acquisitions had been acquired on January 1 of each year presented:
2009 2008
Total revenue $ 5,569,171 $ 6,288,242
The pro forma earnings results of these acquisitions were not material to net income or earnings per share. The pro forma
consolidated results do not purport to be indicative of actual results that would have occurred had the acquisitions been completed on
January 1, 2009 and 2008, nor do they purport to be indicative of the results that will be obtained in the future.