Pitney Bowes 2009 Annual Report Download - page 101
Download and view the complete annual report
Please find page 101 of the 2009 Pitney Bowes annual report below. You can navigate through the pages in the report by either clicking on the pages listed below, or by using the keyword search tool below to find specific information within the annual report.-
 1
1 -
2
-
3
-
4
-
5
-
6
-
7
-
8
-
9
-
10
-
11
-
12
-
13
-
14
-
15
-
16
-
17
-
18
-
19
-
20
-
21
-
22
-
23
-
24
-
25
-
26
-
27
-
28
-
29
-
30
-
31
-
32
-
33
-
34
-
35
-
36
-
37
-
38
-
39
-
40
-
41
-
42
-
43
-
44
-
45
-
46
-
47
-
48
-
49
-
50
-
51
-
52
-
53
-
54
-
55
-
56
-
57
-
58
-
59
-
60
-
61
-
62
-
63
-
64
-
65
-
66
-
67
-
68
-
69
-
70
-
71
-
72
-
73
-
74
-
75
-
76
-
77
-
78
-
79
-
80
-
81
-
82
-
83
-
84
-
85
-
86
-
87
-
88
-
89
-
90
-
 91
91 -
 92
92 -
 93
93 -
 94
94 -
 95
95 -
 96
96 -
 97
97 -
 98
98 -
 99
99 -
 100
100 -
 101
101 -
 102
102 -
 103
103 -
 104
104 -
 105
105 -
 106
106 -
 107
107 -
 108
108 -
 109
109 -
 110
110 -
 111
111 -
112
-
113
-
114
-
115
-
116
-
117
-
118
-
119
-
120
-
121
-
122
-
123
-
124
 |
 |

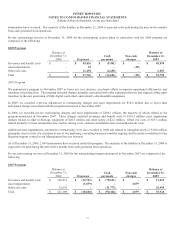
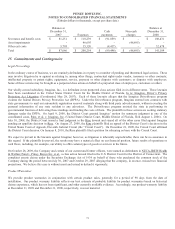
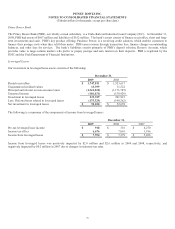
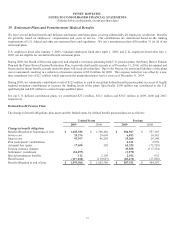
PITNEY BOWES INC.
NOTES TO CONSOLIDATED FINANCIAL STATEMENTS
(Tabular dollars in thousands, except per share data)
83
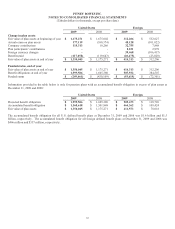
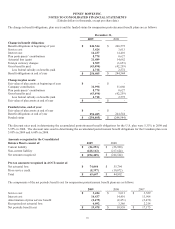
Amounts recognized in the Consolidated United States Foreign
Balance Sheets: 2009 2008 2009 2008
Non-current asset $ - $ - $ 484 $ 184
Current liability (19,424) (6,513) (957) (875)
Non-current liability (230,037) (423,596) (93,146) (71,610)
Net amount recognized $ (249,461) $ (430,109) $ (93,619) $ (72,301)
Pre-tax amounts recognized in accumulated other comprehensive income (“AOCI”) consist of:
Net actuarial loss $ 742,921 $ 833,674 $ 161,441 $ 119,733
Prior service cost/(credit) (40) (113) 756 1,211
Transition obligation (asset) - - (196) (97)
Total $ 742,881 $ 833,561 $ 162,001 $ 120,847
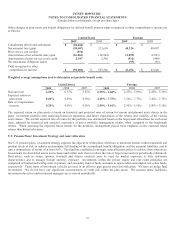
The estimated amounts that will be amortized from AOCI into net periodic benefits cost in 2010 are as follows:
Net actuarial loss $ 30,936 $ 3,858
Prior service cost/(credit) (2,999) 471
Transition obligation - (10)
Total $ 27,937 $ 4,319
Weighted average assumptions used to determine end of year benefit obligations:
Discount rate 5.75% 6.05% 2.25% - 6.00% 2.25% - 6.60%
Rate of compensation increase 3.50% 4.25% 2.50% - 5.60% 2.50% - 5.10%
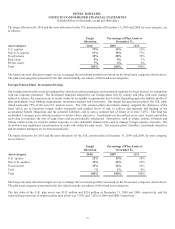
At December 31, 2009 there were no shares of our common stock included in the plan assets of our pension plans.
We anticipate making contributions of up to $20 million each to our U.S. and foreign pension plans during 2010. We will reassess our
funding alternatives as the year progresses.
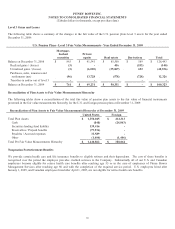
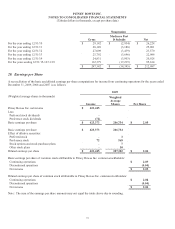
The components of the net periodic benefit cost for defined pension plans are as follows:
United States Foreign
2009 2008 2007 2009 2008 2007
Service cost $ 24,274 $ 29,699 $ 28,500 $ 6,853 $ 10,562 $ 13,427
Interest cost 93,997 96,205 94,173 25,200 29,140 27,720
Expected return on
plan assets (120,662) (132,748) (127,070) (27,193)
(36,713)
(37,079)
Amortization of
transition cost - - - (61) 142 (706)
Amortization of prior
service cost (2,547) (2,560) (2,116) 446 628 663
Recognized net
actuarial loss 26,063 18,944 29,860 2,486 3,981 7,347
Special termination 112 2,105 1,187 2,385 632 906
Settlement / curtailment 4,107 - - 202 - -
Net periodic
benefit cost $ 25,344 $ 11,645 $ 24,534 $ 10,318 $ 8,372 $ 12,278