Pitney Bowes 2009 Annual Report Download - page 75
Download and view the complete annual report
Please find page 75 of the 2009 Pitney Bowes annual report below. You can navigate through the pages in the report by either clicking on the pages listed below, or by using the keyword search tool below to find specific information within the annual report.-
 1
1 -
2
-
3
-
4
-
5
-
6
-
7
-
8
-
9
-
10
-
11
-
12
-
13
-
14
-
15
-
16
-
17
-
18
-
19
-
20
-
21
-
22
-
23
-
24
-
25
-
26
-
27
-
28
-
29
-
30
-
31
-
32
-
33
-
34
-
35
-
36
-
37
-
38
-
39
-
40
-
41
-
42
-
43
-
44
-
45
-
46
-
47
-
48
-
49
-
50
-
51
-
52
-
53
-
54
-
55
-
56
-
57
-
58
-
59
-
60
-
61
-
62
-
63
-
64
-
 65
65 -
 66
66 -
 67
67 -
 68
68 -
 69
69 -
 70
70 -
 71
71 -
 72
72 -
 73
73 -
 74
74 -
 75
75 -
 76
76 -
 77
77 -
 78
78 -
 79
79 -
 80
80 -
 81
81 -
 82
82 -
 83
83 -
 84
84 -
 85
85 -
86
-
87
-
88
-
89
-
90
-
91
-
92
-
93
-
94
-
95
-
96
-
97
-
98
-
99
-
100
-
101
-
102
-
103
-
104
-
105
-
106
-
107
-
108
-
109
-
110
-
111
-
112
-
113
-
114
-
115
-
116
-
117
-
118
-
119
-
120
-
121
-
122
-
123
-
124
 |
 |

PITNEY BOWES INC.
NOTES TO CONSOLIDATED FINANCIAL STATEMENTS
(Tabular dollars in thousands, except per share data)
57
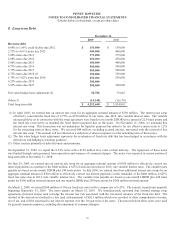
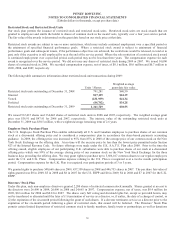
On March 4, 2008, we issued $250 million of 10 year fixed rate notes with a coupon rate of 5.60%. The interest is paid semi-annually
beginning September 2008. The notes mature on March 15, 2018. We simultaneously entered into two interest rate swaps for a total
notional amount of $250 million to convert the fixed rate debt to a floating rate obligation bearing interest at 6 month LIBOR plus
111.5 basis points. The proceeds from these notes were used for general corporate purposes, including the repayment of commercial
paper and repurchase of our stock.
We are a Well-Known Seasoned Issuer with the SEC which allows us to issue debt securities, preferred stock, preference stock,
common stock, purchase contracts, depositary shares, warrants and units.
The annual maturities of the outstanding long-term debt are as follows: 2010 – no maturities; 2011 – no maturities; 2012 – $550
million; 2013 – $375 million; 2014 – $450 million; and $2,800 million thereafter.
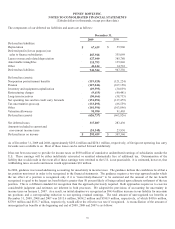
9. Income Taxes
Years ended December 31,
2009 2008 2007
Continuing operations:
Total current $ 251,101 $ 142,263 $ 160,839
Total deferred (10,947) 102,666 119,383
Provision for income taxes $ 240,154 $ 244,929 $ 280,222
U.S. and international components of income from operations before income taxes are as follows:
Years ended December 31,
2009 2008 2007
Continuing operations:
U.S. $ 552,636 $ 573,066 $ 624,030
International 140,540 140,111 36,681
Total continuing operations 693,176 713,177 660,711
Discontinued operations (see Note 2) 20,624 - -
Total $ 713,800 $ 713,177 $ 660,711
The effective tax rates for continuing operations for 2009, 2008 and 2007 were 34.6%, 34.3% and 42.4%, respectively. The effective
tax rate for 2009 included $12.9 million of tax charges related to the write-off of deferred tax assets associated with the expiration of
out-of-the-money vested stock options and the vesting of restricted stock, offset by $13.0 million of tax benefits from retirement of
inter-company obligations and the repricing of leveraged lease transactions. The effective tax rate for 2008 included $12.0 million of
tax increases related to the low tax benefit associated with restructuring expenses recorded during 2008, offset by adjustments of $9.5
million related to deferred tax assets associated with certain U.S. leasing transactions. The effective tax rate for 2007 included $54.0
million of tax charges related principally to a valuation allowance for deferred tax assets and tax rate changes outside of the U.S.