Pitney Bowes 2009 Annual Report Download - page 81
Download and view the complete annual report
Please find page 81 of the 2009 Pitney Bowes annual report below. You can navigate through the pages in the report by either clicking on the pages listed below, or by using the keyword search tool below to find specific information within the annual report.-
 1
1 -
2
-
3
-
4
-
5
-
6
-
7
-
8
-
9
-
10
-
11
-
12
-
13
-
14
-
15
-
16
-
17
-
18
-
19
-
20
-
21
-
22
-
23
-
24
-
25
-
26
-
27
-
28
-
29
-
30
-
31
-
32
-
33
-
34
-
35
-
36
-
37
-
38
-
39
-
40
-
41
-
42
-
43
-
44
-
45
-
46
-
47
-
48
-
49
-
50
-
51
-
52
-
53
-
54
-
55
-
56
-
57
-
58
-
59
-
60
-
61
-
62
-
63
-
64
-
65
-
66
-
67
-
68
-
69
-
70
-
 71
71 -
 72
72 -
 73
73 -
 74
74 -
 75
75 -
 76
76 -
 77
77 -
 78
78 -
 79
79 -
 80
80 -
 81
81 -
 82
82 -
 83
83 -
 84
84 -
 85
85 -
 86
86 -
 87
87 -
 88
88 -
 89
89 -
 90
90 -
 91
91 -
92
-
93
-
94
-
95
-
96
-
97
-
98
-
99
-
100
-
101
-
102
-
103
-
104
-
105
-
106
-
107
-
108
-
109
-
110
-
111
-
112
-
113
-
114
-
115
-
116
-
117
-
118
-
119
-
120
-
121
-
122
-
123
-
124
 |
 |

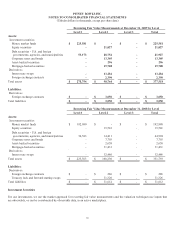
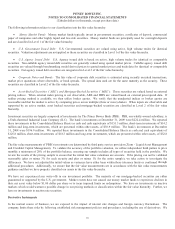
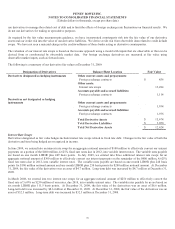
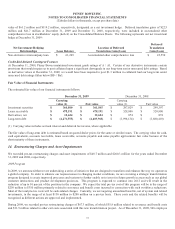
PITNEY BOWES INC.
NOTES TO CONSOLIDATED FINANCIAL STATEMENTS
(Tabular dollars in thousands, except per share data)
63
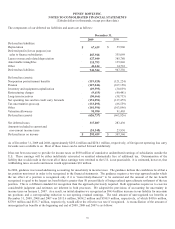
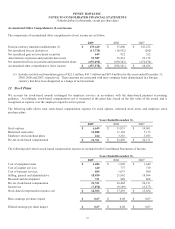
Accumulated Other Comprehensive (Loss) Income
The components of accumulated other comprehensive (loss) income are as follow:
2009 2008 2007
Foreign currency translation adjustments (1) $ 155,620 $ 35,800 $ 341,252
Net unrealized loss on derivatives (11,738) (18,952) (282)
Net unrealized gain on investment securities 649 932 352
Amortization of pension and postretirement costs 53,589 36,261 22,172
Net unamortized loss on pension and postretirement plans (655,498) (650,382) (274,838)
Accumulated other comprehensive (loss) income $ (457,378) $ (596,341) $ 88,656
(1) Includes net deferred translation gains of $22.5 million, $41.7 million and $47.6 million for the years ended December 31,
2009, 2008 and 2007, respectively. These amounts are associated with inter-company loans denominated in a foreign
currency that have been designated as a hedge of net investment.
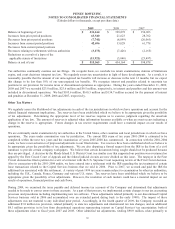
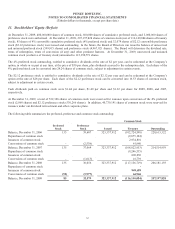
12. Stock Plans
We account for stock-based awards exchanged for employee services in accordance with the share-based payment accounting
guidance. Accordingly, stock-based compensation cost is measured at the grant date, based on the fair value of the award, and is
recognized as expense over the employee requisite service period.
The following table shows total stock-based compensation expense for stock options, restricted stock units, and employee stock
purchase plans.
Years Ended December 31,
2009 2008 2007
Stock options $ 6,649 $ 11,851 $ 14,001
Restricted stock units 14,888 11,168 7,115
Employee stock purchase plans 224 3,383 3,015
Pre-tax stock-based compensation $ 21,761 $ 26,402 $ 24,131
The following table shows stock-based compensation expense as included in the Consolidated Statements of Income:
Years Ended December 31,
2009 2008 2007
Cost of equipment sales $ 1,486 $ 1,802 $ 1,649
Cost of support services 640 777 710
Cost of business services 884 1,073 980
Selling, general and administrative 18,020 21,862 19,984
Research and development 731 888 808
Pre-tax stock-based compensation 21,761 26,402 24,131
Income tax (7,458) (9,109) (8,277)
Stock-based compensation expense, net $ 14,303 $ 17,293 $ 15,854
Basic earnings per share impact $ 0.07 $ 0.08 $ 0.07
Diluted earnings per share impact $ 0.07 $ 0.08 $ 0.07