Pitney Bowes 2009 Annual Report Download - page 70
Download and view the complete annual report
Please find page 70 of the 2009 Pitney Bowes annual report below. You can navigate through the pages in the report by either clicking on the pages listed below, or by using the keyword search tool below to find specific information within the annual report.-
 1
1 -
2
-
3
-
4
-
5
-
6
-
7
-
8
-
9
-
10
-
11
-
12
-
13
-
14
-
15
-
16
-
17
-
18
-
19
-
20
-
21
-
22
-
23
-
24
-
25
-
26
-
27
-
28
-
29
-
30
-
31
-
32
-
33
-
34
-
35
-
36
-
37
-
38
-
39
-
40
-
41
-
42
-
43
-
44
-
45
-
46
-
47
-
48
-
49
-
50
-
51
-
52
-
53
-
54
-
55
-
56
-
57
-
58
-
59
-
 60
60 -
 61
61 -
 62
62 -
 63
63 -
 64
64 -
 65
65 -
 66
66 -
 67
67 -
 68
68 -
 69
69 -
 70
70 -
 71
71 -
 72
72 -
 73
73 -
 74
74 -
 75
75 -
 76
76 -
 77
77 -
 78
78 -
 79
79 -
 80
80 -
81
-
82
-
83
-
84
-
85
-
86
-
87
-
88
-
89
-
90
-
91
-
92
-
93
-
94
-
95
-
96
-
97
-
98
-
99
-
100
-
101
-
102
-
103
-
104
-
105
-
106
-
107
-
108
-
109
-
110
-
111
-
112
-
113
-
114
-
115
-
116
-
117
-
118
-
119
-
120
-
121
-
122
-
123
-
124
 |
 |

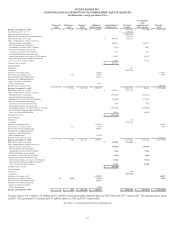
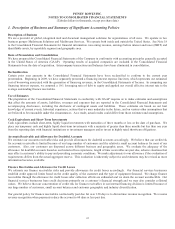
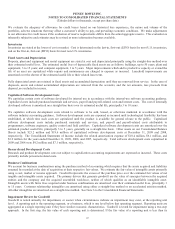
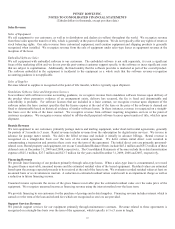
PITNEY BOWES INC.
NOTES TO CONSOLIDATED FINANCIAL STATEMENTS
(Tabular dollars in thousands, except per share data)
52
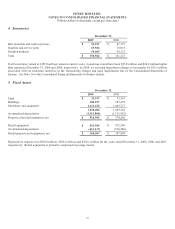
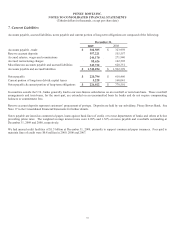
4. Inventories
December 31,
2009 2008
Raw materials and work in process $ 36,331 $ 41,171
Supplies and service parts 69,506 78,018
Finished products 50,665 42,132
Total $ 156,502 $ 161,321
If all inventories valued at LIFO had been stated at current costs, inventories would have been $25.8 million and $24.4 million higher
than reported at December 31, 2009 and 2008, respectively. In 2008, we recorded impairment charges to inventories for $13.6 million
associated with our transition initiatives in the restructuring charges and asset impairments line of the Consolidated Statements of
Income. See Note 14 to the Consolidated Financial Statements for further details.
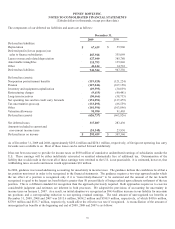
5. Fixed Assets
December 31,
2009 2008
Land $ 32,517 $ 32,367
Buildings 384,257 387,478
Machinery and equipment 1,413,630 1,469,717
1,830,404 1,889,562
Accumulated depreciation (1,315,500) (1,315,302)
Property, plant and equipment, net $ 514,904 $ 574,260
Rental equipment $ 813,544 $ 932,389
Accumulated depreciation (453,337) (534,440)
Rental property and equipment, net $ 360,207 $ 397,949
Depreciation expense was $269.8 million, $306.8 million and $318.1 million for the years ended December 31, 2009, 2008, and 2007,
respectively. Rental equipment is primarily comprised of postage meters.