Pitney Bowes 2009 Annual Report Download - page 58
Download and view the complete annual report
Please find page 58 of the 2009 Pitney Bowes annual report below. You can navigate through the pages in the report by either clicking on the pages listed below, or by using the keyword search tool below to find specific information within the annual report.-
 1
1 -
2
-
3
-
4
-
5
-
6
-
7
-
8
-
9
-
10
-
11
-
12
-
13
-
14
-
15
-
16
-
17
-
18
-
19
-
20
-
21
-
22
-
23
-
24
-
25
-
26
-
27
-
28
-
29
-
30
-
31
-
32
-
33
-
34
-
35
-
36
-
37
-
38
-
39
-
40
-
41
-
42
-
43
-
44
-
45
-
46
-
47
-
 48
48 -
 49
49 -
 50
50 -
 51
51 -
 52
52 -
 53
53 -
 54
54 -
 55
55 -
 56
56 -
 57
57 -
 58
58 -
 59
59 -
 60
60 -
 61
61 -
 62
62 -
 63
63 -
 64
64 -
 65
65 -
 66
66 -
 67
67 -
 68
68 -
69
-
70
-
71
-
72
-
73
-
74
-
75
-
76
-
77
-
78
-
79
-
80
-
81
-
82
-
83
-
84
-
85
-
86
-
87
-
88
-
89
-
90
-
91
-
92
-
93
-
94
-
95
-
96
-
97
-
98
-
99
-
100
-
101
-
102
-
103
-
104
-
105
-
106
-
107
-
108
-
109
-
110
-
111
-
112
-
113
-
114
-
115
-
116
-
117
-
118
-
119
-
120
-
121
-
122
-
123
-
124
 |
 |

40
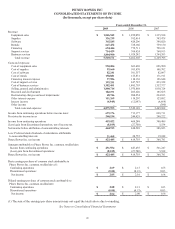
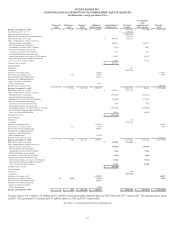
PITNEY BOWES INC.
CONSOLIDATED STATEMENTS OF INCOME
(In thousands, except per share data)
Years ended December 31,
2009 2008 2007
Revenue:
Equipment sales $ 1,006,542 $ 1,252,058 $ 1,335,538
Supplies 336,239 392,414 393,478
Software 365,185 424,296 346,020
Rentals 647,432 728,160 739,130
Financing 694,444 772,711 790,121
Support services 714,429 768,424 760,915
Business services 1,804,900 1,924,242 1,764,593
Total revenue 5,569,171 6,262,305 6,129,795
Costs and expenses:
Cost of equipment sales 530,004 663,430 696,900
Cost of supplies 93,660 103,870 106,702
Cost of software 82,241 101,357 82,097
Cost of rentals 158,881 153,831 171,191
Financing interest expense 97,586 110,136 126,648
Cost of support services 393,251 447,745 433,324
Cost of business services 1,382,401 1,485,703 1,357,377
Selling, general and administrative 1,800,714 1,970,868 1,930,324
Research and development 182,191 205,620 185,665
Restructuring charges and asset impairments 48,746 200,254 264,013
Other interest expense 111,269 119,207 123,892
Interest income (4,949) (12,893) (8,669)
Other income - - (380)
Total costs and expenses 4,875,995 5,549,128 5,469,084
Income from continuing operations before income taxes 693,176 713,177 660,711
Provision for income taxes 240,154 244,929 280,222
Income from continuing operations 453,022 468,248 380,489
(Loss) gain from discontinued operations, net of income tax (8,109) (27,700) 5,534
Net income before attribution of noncontrolling interests 444,913 440,548 386,023
Less: Preferred stock dividends of subsidiaries attributable
to noncontrolling interests 21,468 20,755 19,242
Pitney Bowes Inc. net income $ 423,445 $ 419,793 $ 366,781
Amounts attributable to Pitney Bowes Inc. common stockholders:
Income from continuing operations $ 431,554 $ 447,493 $ 361,247
(Loss) gain from discontinued operations (8,109) (27,700) 5,534
Pitney Bowes Inc. net income $ 423,445 $ 419,793 $ 366,781
Basic earnings per share of common stock attributable to
Pitney Bowes Inc. common stockholders (1):
Continuing operations $ 2.09 $ 2.15 $ 1.65
Discontinued operations (0.04) (0.13) 0.03
Net income $ 2.05 $ 2.01 $ 1.68
Diluted earnings per share of common stock attributable to
Pitney Bowes Inc. common stockholders:
Continuing operations $ 2.08 $ 2.13 $ 1.63
Discontinued operations (0.04) (0.13) 0.03
Net income $ 2.04 $ 2.00 $ 1.66
(1) The sum of the earnings per share amounts may not equal the totals above due to rounding.
See Notes to Consolidated Financial Statements