Pitney Bowes 2009 Annual Report Download - page 33
Download and view the complete annual report
Please find page 33 of the 2009 Pitney Bowes annual report below. You can navigate through the pages in the report by either clicking on the pages listed below, or by using the keyword search tool below to find specific information within the annual report.-
 1
1 -
2
-
3
-
4
-
5
-
6
-
7
-
8
-
9
-
10
-
11
-
12
-
13
-
14
-
15
-
16
-
17
-
18
-
19
-
20
-
21
-
22
-
 23
23 -
 24
24 -
 25
25 -
 26
26 -
 27
27 -
 28
28 -
 29
29 -
 30
30 -
 31
31 -
 32
32 -
 33
33 -
 34
34 -
 35
35 -
 36
36 -
 37
37 -
 38
38 -
 39
39 -
 40
40 -
 41
41 -
 42
42 -
 43
43 -
44
-
45
-
46
-
47
-
48
-
49
-
50
-
51
-
52
-
53
-
54
-
55
-
56
-
57
-
58
-
59
-
60
-
61
-
62
-
63
-
64
-
65
-
66
-
67
-
68
-
69
-
70
-
71
-
72
-
73
-
74
-
75
-
76
-
77
-
78
-
79
-
80
-
81
-
82
-
83
-
84
-
85
-
86
-
87
-
88
-
89
-
90
-
91
-
92
-
93
-
94
-
95
-
96
-
97
-
98
-
99
-
100
-
101
-
102
-
103
-
104
-
105
-
106
-
107
-
108
-
109
-
110
-
111
-
112
-
113
-
114
-
115
-
116
-
117
-
118
-
119
-
120
-
121
-
122
-
123
-
124
 |
 |

15
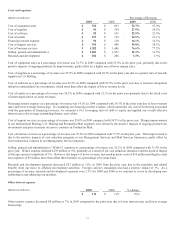
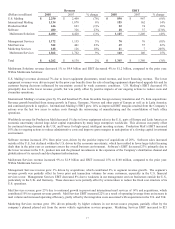
Costs and expenses
(Dollars in millions) Percentage of Revenue
2009 2008 2009 2008
Cost of equipment sales $530 $663 52.7% 53.0%
Cost of supplies $94 $104 27.9% 26.5%
Cost of software $82 $101 22.5% 23.9%
Cost of rentals $159 $154 24.5% 21.1%
Financing interest expense $98 $110 14.1% 14.3%
Cost of support services $393 $448 55.0% 58.3%
Cost of business services $1,382 $1,486 76.6% 77.2%
Selling, general and administrative $1,801 $1,971 32.3% 31.5%
Research and development $182 $206 3.3% 3.3%
Cost of equipment sales as a percentage of revenue was 52.7% in 2009 compared with 53.0% in the prior year, primarily due to the
positive impacts of ongoing productivity improvements, partly offset by a higher mix of lower margin sales.
Cost of supplies as a percentage of revenue was 27.9% in 2009 compared with 26.5% in the prior year due to a greater mix of non-ink
supplies in U.S Mailing.
Cost of software as a percentage of revenue was 22.5% in 2009 compared with 23.9% in the prior year due to business integration
initiatives and productivity investments, which more than offset the impact of lower revenue levels.
Cost of rentals as a percentage of revenue was 24.5% in 2009 compared with 21.1% in the prior year primarily due to the fixed costs
of meter depreciation on lower revenues.
Financing interest expense as a percentage of revenue was 14.1% in 2009 compared with 14.3% in the prior year due to lower interest
rates and lower average borrowings. In computing our financing interest expense, which represents our cost of borrowing associated
with the generation of financing revenues, we assumed a 10:1 leveraging ratio of debt to equity and applied our overall effective
interest rate to the average outstanding finance receivables.
Cost of support services as a percentage of revenue was 55.0% in 2009 compared with 58.3% in the prior year. Margin improvements
in our International Mailing, U.S. Mailing and Production Mail segments were driven by the positive impacts of ongoing productivity
investments and price increases on service contracts in Production Mail.
Cost of business services as a percentage of revenue was 76.6% in 2009 compared with 77.2% in the prior year. This improvement is
due to the positive impacts of cost reduction programs at our Management Services and Mail Services businesses, partly offset by
lower transaction volumes in our Management Services business.
Selling, general and administrative (“SG&A”) expenses as a percentage of revenue was 32.3% in 2009 compared with 31.5% in the
prior year. SG&A expense declined $170 million or 9%, primarily as a result of our cost reduction initiatives and the positive impact
of foreign currency translation of 3%. However, the impact of lower revenue, increased pension costs of $14 million and higher credit
loss expenses of $9 million more than offset these benefits on a percentage of revenue basis.
Research and development expenses decreased $23 million or 11%, in 2009 from the prior year due to the transition and related
benefits from our move to offshore development activities. Foreign currency translation also had a positive impact of 3%. As a
percentage of revenue, research and development expenses were 3.3% for 2009 and 2008 as we continue to invest in developing new
technologies and enhancing our products.
Other interest expense
(Dollars in millions) 2009 2008 % change
$ 111 $ 119 (7)%
Other interest expense decreased $8 million or 7% in 2009 compared to the prior year due to lower interest rates and lower average
borrowings.