Pitney Bowes 2009 Annual Report Download - page 16
Download and view the complete annual report
Please find page 16 of the 2009 Pitney Bowes annual report below. You can navigate through the pages in the report by either clicking on the pages listed below, or by using the keyword search tool below to find specific information within the annual report.-
 1
1 -
2
-
3
-
4
-
5
-
 6
6 -
 7
7 -
 8
8 -
 9
9 -
 10
10 -
 11
11 -
 12
12 -
 13
13 -
 14
14 -
 15
15 -
 16
16 -
 17
17 -
 18
18 -
 19
19 -
 20
20 -
 21
21 -
 22
22 -
 23
23 -
 24
24 -
 25
25 -
 26
26 -
27
-
28
-
29
-
30
-
31
-
32
-
33
-
34
-
35
-
36
-
37
-
38
-
39
-
40
-
41
-
42
-
43
-
44
-
45
-
46
-
47
-
48
-
49
-
50
-
51
-
52
-
53
-
54
-
55
-
56
-
57
-
58
-
59
-
60
-
61
-
62
-
63
-
64
-
65
-
66
-
67
-
68
-
69
-
70
-
71
-
72
-
73
-
74
-
75
-
76
-
77
-
78
-
79
-
80
-
81
-
82
-
83
-
84
-
85
-
86
-
87
-
88
-
89
-
90
-
91
-
92
-
93
-
94
-
95
-
96
-
97
-
98
-
99
-
100
-
101
-
102
-
103
-
104
-
105
-
106
-
107
-
108
-
109
-
110
-
111
-
112
-
113
-
114
-
115
-
116
-
117
-
118
-
119
-
120
-
121
-
122
-
123
-
124
 |
 |

14
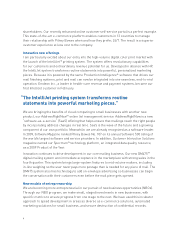
We are targeting annualized benefits, net of investments, from our strategic transformation initiatives in
the range of at least $150 million to $200 million on a pretax basis, and a related reduction in the number
of required positions in the company. We expect the full-run rate to be achieved by 2012. We expect that the
total related pretax costs associated with this program will be in the range of $250 million to $350 million
and that most of these charges will be cash-related.
As we look ahead to 2010, we expect improving year-over-year performance, primarily in the second half
of the year as the benefits from our strategic transformation start to build. In addition, we have continued
to invest in new products and solutions for our customers and expect our recently announced strategic
partnerships to begin to contribute to growth.
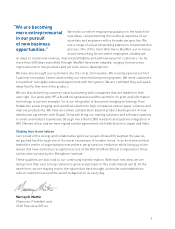
These factors have given us the confidence to increase our dividend for the 28th consecutive year. We were
pleased that our Board of Directors decided to increase our dividend to $0.365 per common share for the
first quarter of 2010.
We believe we are focused on the right priorities to deliver value in a changing business environment.
We are investing for growth while continuing to lower our cost structure. We are committed to providing
our shareholders with an excellent return through an attractive dividend yield and renewed growth in
earnings per share.
Michael Monahan
Executive Vice President
and Chief Financial Officer
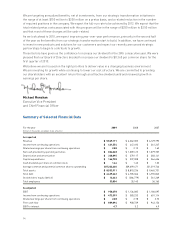
Summary of Selected Financial Data
For the year 2009 2008 2007
(Dollars in thousands, except per share amounts)
As reported
Revenue $ 5,569,171 $ 6,262,305 $ 6,129,795
Income from continuing operations $ 431,554 $ 447,493 $ 361,247
Diluted earnings per share from continuing operations $ 2.08 $ 2.13 $ 1.63
Net cash provided by operating activities $ 824,068 $ 1,009,415 $ 1,079,707
Depreciation and amortization $ 338,895 $ 379,117 $ 383,141
Capital expenditures $ 166,728 $ 237,308 $ 264,656
Cash dividends per share of common stock $ 1.44 $ 1.40 $ 1.32
Average common and potential common shares outstanding 207,322,440 209,699,471 221,219,746
Total assets $ 8,533,911 $ 8,810,236 $ 9,465,731
Total debt $ 4,439,662 $ 4,705,366 $ 4,755,842
Stockholders’ equity (deficit) $ 13,663 $ (286,779) $ 561,269
Total employees 33,004 35,140 36,165
As adjusted
EBIT $ 950,278 $ 1,136,085 $ 1,186,097
Income from continuing operations $ 473,399 $ 583,233 $ 601,114
Diluted earnings per share from continuing operations $ 2.28 $ 2.78 $ 2.72
Free cash flow $ 889,094 $ 908,739 $ 943,156
EBIT to interest 4.7 5.2 4.9