Pitney Bowes 2009 Annual Report Download - page 108
Download and view the complete annual report
Please find page 108 of the 2009 Pitney Bowes annual report below. You can navigate through the pages in the report by either clicking on the pages listed below, or by using the keyword search tool below to find specific information within the annual report.-
 1
1 -
2
-
3
-
4
-
5
-
6
-
7
-
8
-
9
-
10
-
11
-
12
-
13
-
14
-
15
-
16
-
17
-
18
-
19
-
20
-
21
-
22
-
23
-
24
-
25
-
26
-
27
-
28
-
29
-
30
-
31
-
32
-
33
-
34
-
35
-
36
-
37
-
38
-
39
-
40
-
41
-
42
-
43
-
44
-
45
-
46
-
47
-
48
-
49
-
50
-
51
-
52
-
53
-
54
-
55
-
56
-
57
-
58
-
59
-
60
-
61
-
62
-
63
-
64
-
65
-
66
-
67
-
68
-
69
-
70
-
71
-
72
-
73
-
74
-
75
-
76
-
77
-
78
-
79
-
80
-
81
-
82
-
83
-
84
-
85
-
86
-
87
-
88
-
89
-
90
-
91
-
92
-
93
-
94
-
95
-
96
-
97
-
 98
98 -
 99
99 -
 100
100 -
 101
101 -
 102
102 -
 103
103 -
 104
104 -
 105
105 -
 106
106 -
 107
107 -
 108
108 -
 109
109 -
 110
110 -
 111
111 -
 112
112 -
 113
113 -
 114
114 -
 115
115 -
 116
116 -
 117
117 -
 118
118 -
119
-
120
-
121
-
122
-
123
-
124
 |
 |

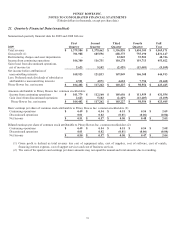
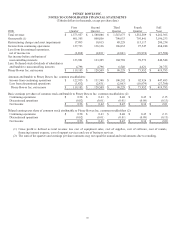
PITNEY BOWES INC.
NOTES TO CONSOLIDATED FINANCIAL STATEMENTS
(Tabular dollars in thousands, except per share data)
90
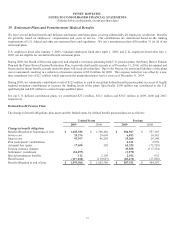
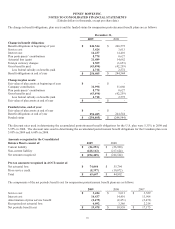
Other changes in plan assets and benefit obligations for nonpension postretirement benefit plans recognized in other comprehensive
income are as follows:
2009 2008
Net actuarial loss (gain) $ 21,367 $ 15,067
Prior service cost (credit) - -
Amortization of net actuarial (loss) gain (4,092) (3,257)
Amortization of prior service (cost) credit 2,475 2,478
Adjustment for actual Medicare Part D Premium 1,005 1,191
Total recognized in other comprehensive income $ 20,755 $ 15,479
Weighted average assumptions used to determine net periodic costs during the years:
2009 2008 2007
Discount rate – U.S. 5.95% 5.90% 5.85%
Discount rate – Canada 6.60% 5.25% 5.00%
The estimated amounts that will be amortized from AOCI into net periodic benefit cost in 2010 are as follows:
Net actuarial loss $ 5,894
Prior service credit (2,513)
Total $ 3,381
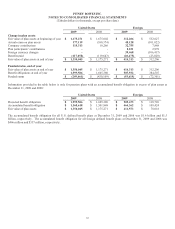
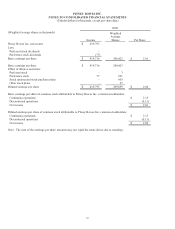
The assumed health care cost trend rate used in measuring the accumulated postretirement benefit obligations for the U.S. plan was
7.50% for 2009 and 8.00% for 2008. The assumed health care trend rate is 7.50% for 2010 and we assume it will gradually decline to
5.00% by the year 2015 and remain at that level thereafter.
Assumed health care cost trend rates have a significant effect on the amounts reported for the health care plans. A 1% change in the
assumed health care cost trend rates would have the following effects:
1% Increase 1% Decrease
Effect on total of service and interest cost components $ 590 $ (507)
Effect on postretirement benefit obligations $ 8,693 $ (7,584)
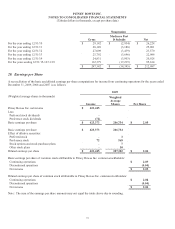
Estimated Future Benefit Payments
The following benefit payments, which reflect expected future service, as appropriate, are expected to be paid:
Pension
Benefits
For the year ending 12/31/10 $ 133,052
For the year ending 12/31/11 123,634
For the year ending 12/31/12 131,716
For the year ending 12/31/13 134,787
For the year ending 12/31/14 139,896
For the years ending 12/31/15-12/31/19 723,097
$ 1,386,182