Pitney Bowes 2009 Annual Report Download - page 109
Download and view the complete annual report
Please find page 109 of the 2009 Pitney Bowes annual report below. You can navigate through the pages in the report by either clicking on the pages listed below, or by using the keyword search tool below to find specific information within the annual report.-
 1
1 -
2
-
3
-
4
-
5
-
6
-
7
-
8
-
9
-
10
-
11
-
12
-
13
-
14
-
15
-
16
-
17
-
18
-
19
-
20
-
21
-
22
-
23
-
24
-
25
-
26
-
27
-
28
-
29
-
30
-
31
-
32
-
33
-
34
-
35
-
36
-
37
-
38
-
39
-
40
-
41
-
42
-
43
-
44
-
45
-
46
-
47
-
48
-
49
-
50
-
51
-
52
-
53
-
54
-
55
-
56
-
57
-
58
-
59
-
60
-
61
-
62
-
63
-
64
-
65
-
66
-
67
-
68
-
69
-
70
-
71
-
72
-
73
-
74
-
75
-
76
-
77
-
78
-
79
-
80
-
81
-
82
-
83
-
84
-
85
-
86
-
87
-
88
-
89
-
90
-
91
-
92
-
93
-
94
-
95
-
96
-
97
-
98
-
 99
99 -
 100
100 -
 101
101 -
 102
102 -
 103
103 -
 104
104 -
 105
105 -
 106
106 -
 107
107 -
 108
108 -
 109
109 -
 110
110 -
 111
111 -
 112
112 -
 113
113 -
 114
114 -
 115
115 -
 116
116 -
 117
117 -
 118
118 -
 119
119 -
120
-
121
-
122
-
123
-
124
 |
 |

PITNEY BOWES INC.
NOTES TO CONSOLIDATED FINANCIAL STATEMENTS
(Tabular dollars in thousands, except per share data)
91
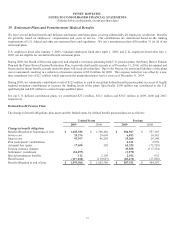
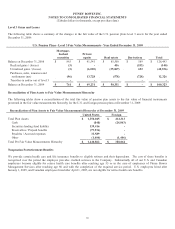
Nonpension
Gross
Medicare Part
D Subsidy Net
For the year ending 12/31/10 $ 29,182 $ (2,954) $ 26,228
For the year ending 12/31/11 28,189 (3,188) 25,001
For the year ending 12/31/12 27,009 (3,439) 23,570
For the year ending 12/31/13 25,792 (3,696) 22,096
For the year ending 12/31/14 24,831 (3,903) 20,928
For the years ending 12/31/15-12/31/19 112,379 (17,215) 95,164
$ 247,382 $ (34,395) $ 212,987
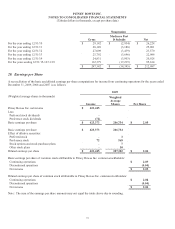
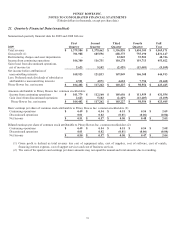
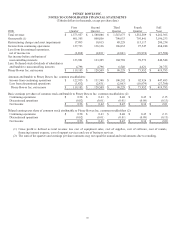
20. Earnings per Share
A reconciliation of the basic and diluted earnings per share computations for income from continuing operations for the years ended
December 31, 2009, 2008 and 2007 is as follows:
2009
(Weighted average shares in thousands)
Income
Weighted
Average
Shares Per Share
Pitney Bowes Inc. net income $ 423,445
Less:
Preferred stock dividends -
Preference stock dividends (72)
Basic earnings per share $ 423,373 206,734 $ 2.05
Basic earnings per share $ 423,373 206,734
Effect of dilutive securities:
Preferred stock - 3
Preference stock 72 568
Stock options and stock purchase plans - 7
Other stock plans - 10
Diluted earnings per share $ 423,445 207,322 $ 2.04
Basic earnings per share of common stock attributable to Pitney Bowes Inc. common stockholders:
Continuing operations $ 2.09
Discontinued operations (0.04)
Net income $ 2.05
Diluted earnings per share of common stock attributable to Pitney Bowes Inc. common stockholders:
Continuing operations $ 2.08
Discontinued operations (0.04)
Net income $ 2.04
Note: The sum of the earnings per share amounts may not equal the totals above due to rounding.