Pitney Bowes 2009 Annual Report Download - page 28
Download and view the complete annual report
Please find page 28 of the 2009 Pitney Bowes annual report below. You can navigate through the pages in the report by either clicking on the pages listed below, or by using the keyword search tool below to find specific information within the annual report.-
 1
1 -
2
-
3
-
4
-
5
-
6
-
7
-
8
-
9
-
10
-
11
-
12
-
13
-
14
-
15
-
16
-
17
-
 18
18 -
 19
19 -
 20
20 -
 21
21 -
 22
22 -
 23
23 -
 24
24 -
 25
25 -
 26
26 -
 27
27 -
 28
28 -
 29
29 -
 30
30 -
 31
31 -
 32
32 -
 33
33 -
 34
34 -
 35
35 -
 36
36 -
 37
37 -
 38
38 -
39
-
40
-
41
-
42
-
43
-
44
-
45
-
46
-
47
-
48
-
49
-
50
-
51
-
52
-
53
-
54
-
55
-
56
-
57
-
58
-
59
-
60
-
61
-
62
-
63
-
64
-
65
-
66
-
67
-
68
-
69
-
70
-
71
-
72
-
73
-
74
-
75
-
76
-
77
-
78
-
79
-
80
-
81
-
82
-
83
-
84
-
85
-
86
-
87
-
88
-
89
-
90
-
91
-
92
-
93
-
94
-
95
-
96
-
97
-
98
-
99
-
100
-
101
-
102
-
103
-
104
-
105
-
106
-
107
-
108
-
109
-
110
-
111
-
112
-
113
-
114
-
115
-
116
-
117
-
118
-
119
-
120
-
121
-
122
-
123
-
124
 |
 |

10
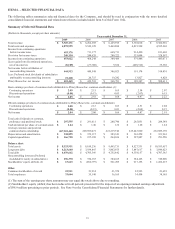
ITEM 6. – SELECTED FINANCIAL DATA
The following tables summarize selected financial data for the Company, and should be read in conjunction with the more detailed
consolidated financial statements and related notes thereto included under Item 8 of this Form 10-K.
Summary of Selected Financial Data
(Dollars in thousands, except per share amounts)
Years ended December 31,
2009 2008 2007 2006 2005
Total revenue $ 5,569,171 $ 6,262,305 $ 6,129,795 $ 5,730,018 $ 5,366,936
Total costs and expenses 4,875,995 5,549,128 5,469,084 4,815,528 4,555,268
Income from continuing operations
before income taxes 693,176 713,177 660,711 914,490 811,668
Provision for income taxes 240,154 244,929 280,222 335,004 328,597
Income from continuing operations 453,022 468,248 380,489 579,486 483,071
(Loss) gain from discontinued operations,
net of income tax (8,109) (27,700) 5,534 (460,312) 35,368
Net income before attribution of
noncontrolling interests 444,913 440,548 386,023 119,174 518,439
Less: Preferred stock dividends of subsidiaries
attributable to noncontrolling interests 21,468 20,755 19,242 13,827 9,828
Pitney Bowes Inc. net income 423,445 $ 419,793 $ 366,781 $ 105,347 $ 508,611
Basic earnings per share of common stock attributable to Pitney Bowes Inc. common stockholders (1):
Continuing operations $ 2.09 $2.15 $ 1.65 $ 2.54 $ 2.07
Discontinued operations (0.04) (0.13) 0.03 (2.07) 0.15
Net income $ 2.05 $2.01 $ 1.68 $ 0.47 $ 2.22
Diluted earnings per share of common stock attributable to Pitney Bowes Inc. common stockholders:
Continuing operations $ 2.08 $2.13 $ 1.63 $ 2.51 $ 2.04
Discontinued operations (0.04) (0.13) 0.03 (2.04) 0.15
Net income $ 2.04 $2.00 $ 1.66 $ 0.47 $ 2.19
Total cash dividends on common,
preference and preferred stock $ 297,555 $ 291,611 $ 288,790 $ 285,051 $ 284,348
Cash dividends per share of common stock $ 1.44 $1.40 $ 1.32 $ 1.28 $ 1.24
Average common and potential
common shares outstanding 207,322,440 209,699,471 221,219,746 225,443,060 232,089,178
Depreciation and amortization $ 338,895 $ 379,117 $ 383,141 $ 363,258 $ 331,963
Capital expenditures $ 166,728 $ 237,308 $ 264,656 $ 327,887 $ 291,550
Balance sheet
Total assets $ 8,533,911 $ 8,810,236 $ 9,465,731 $ 8,527,331 $ 10,553,957
Long-term debt $ 4,213,640 $ 3,934,865 $ 3,802,075 $ 3,847,617 $ 3,849,623
Total debt $ 4,439,662 4,705,366 $ 4,755,842 $ 4,338,157 $ 4,707,365
Noncontrolling interests (Preferred
stockholders' equity in subsidiaries) $ 296,370 $ 374,165 $ 384,165 $ 384,165 $ 310,000
Stockholders’ equity (deficit) (2) $ 13,663 $ (286,779) $ 561,269 $ 617,155 $ 1,282,215
Other
Common stockholders of record 22,911 21,914 21,574 22,923 23,639
Total employees 33,004 35,140 36,165 34,454 34,165
(1) The sum of the earnings per share amounts may not equal the totals above due to rounding.
(2) Stockholders' equity (deficit) has been reduced in all periods presented for the impact of an opening retained earnings adjustment
of $98.9 million pertaining to prior periods. See Note 9 to the Consolidated Financial Statements for further details.
$
$